June 15, 2023
As we dive into the 2023 European green crab trapping season, it’s important to reflect on the insights gained from the coastal green crab populations in 2022. This summary of green crab observations from Washington’s coastal estuaries complements our Inland 2022 wrap-up, rounding out our focus on the trends and patterns observed from green crab trapping results across the state. We pulled from several different data sources to piece together an understanding of changing population dynamics on the coast, from the expansion into new habitats to changes in abundance and seasonal trends.
Green crabs are expanding into fringe habitats
We know from previous years of trapping on Washington’s coast that the invasive European green crab is fairly ubiquitous, and often abundant, throughout the coastal estuaries of Grays Harbor and Willapa Bay. These estuaries share similar features including soft-bottom, muddy sediments; marshy, braided channels; and protection from the high energy waves of the open coastline. While green crabs are often found in rocky intertidal beaches in New England, they are typically not associated with these habitats on the Olympic coast. Stretches of exposed beach have been intermittently trapped, including at Ozette, La Push and Queets, but there has been little evidence of green crabs moving into the rocky intertidal until now. As green crab become more abundant in the larger, soft-bottom coastal estuaries, we may also begin to detect them more frequently in the rocky intertidal zones than we have in the past, potentially as a spillover into these new habitats. Anecdotally, researchers in Oregon have also begun to notice this pattern in the last year.
Makah Bay
Though populations in Makah Bay are most densely concentrated at the mouths of the Tsoo-Yess and Wa’atch rivers, green crabs had been observed in more open habitat types on occasion, including the first green crab detected at the site in 2017. In 2022, the Makah Fisheries Department experimented with trapping at two rocky intertidal sites. While one site yielded a low average with only 7 green crabs in 12 traps, the other site (Wa’atch Point) produced over 1,000 green crabs in just 47 traps (Figure 1a). While further investigation is needed to determine if green crabs are successfully establishing populations in marginal locations, these findings indicate the potential for green crabs to colonize new habitat types in Washington.
Cape Disappointment
At the southern end of Washington Coast, the Washington Department of Fish and Wildlife (WDFW) trapped five green crabs in 140 trap sets at two sites within Cape Disappointment State Park in August 2022. Previously, in June 2021, WDFW and WSG trapped these same two sites and captured zero green crabs in traps, though two live green crabs were hand-captured while deploying traps. This catch rate remains low, especially in comparison to other coastal sites, but the detection of green crabs in the lower Columbia River estuary further illustrates that larger populations elsewhere in Washington, coupled with high larval pressure off the coastline, is leading to spillover into new habitats where crabs had not been previously detected. The high flow and freshwater input of the Columbia River is likely enough to stave off growing green crab populations in the river and portions of this estuary, and trapping at other locations along the Columbia River supports that; in a total of 175 traps set in the Columbia outside of Cape Disappointment State Park, no green crabs have been captured.
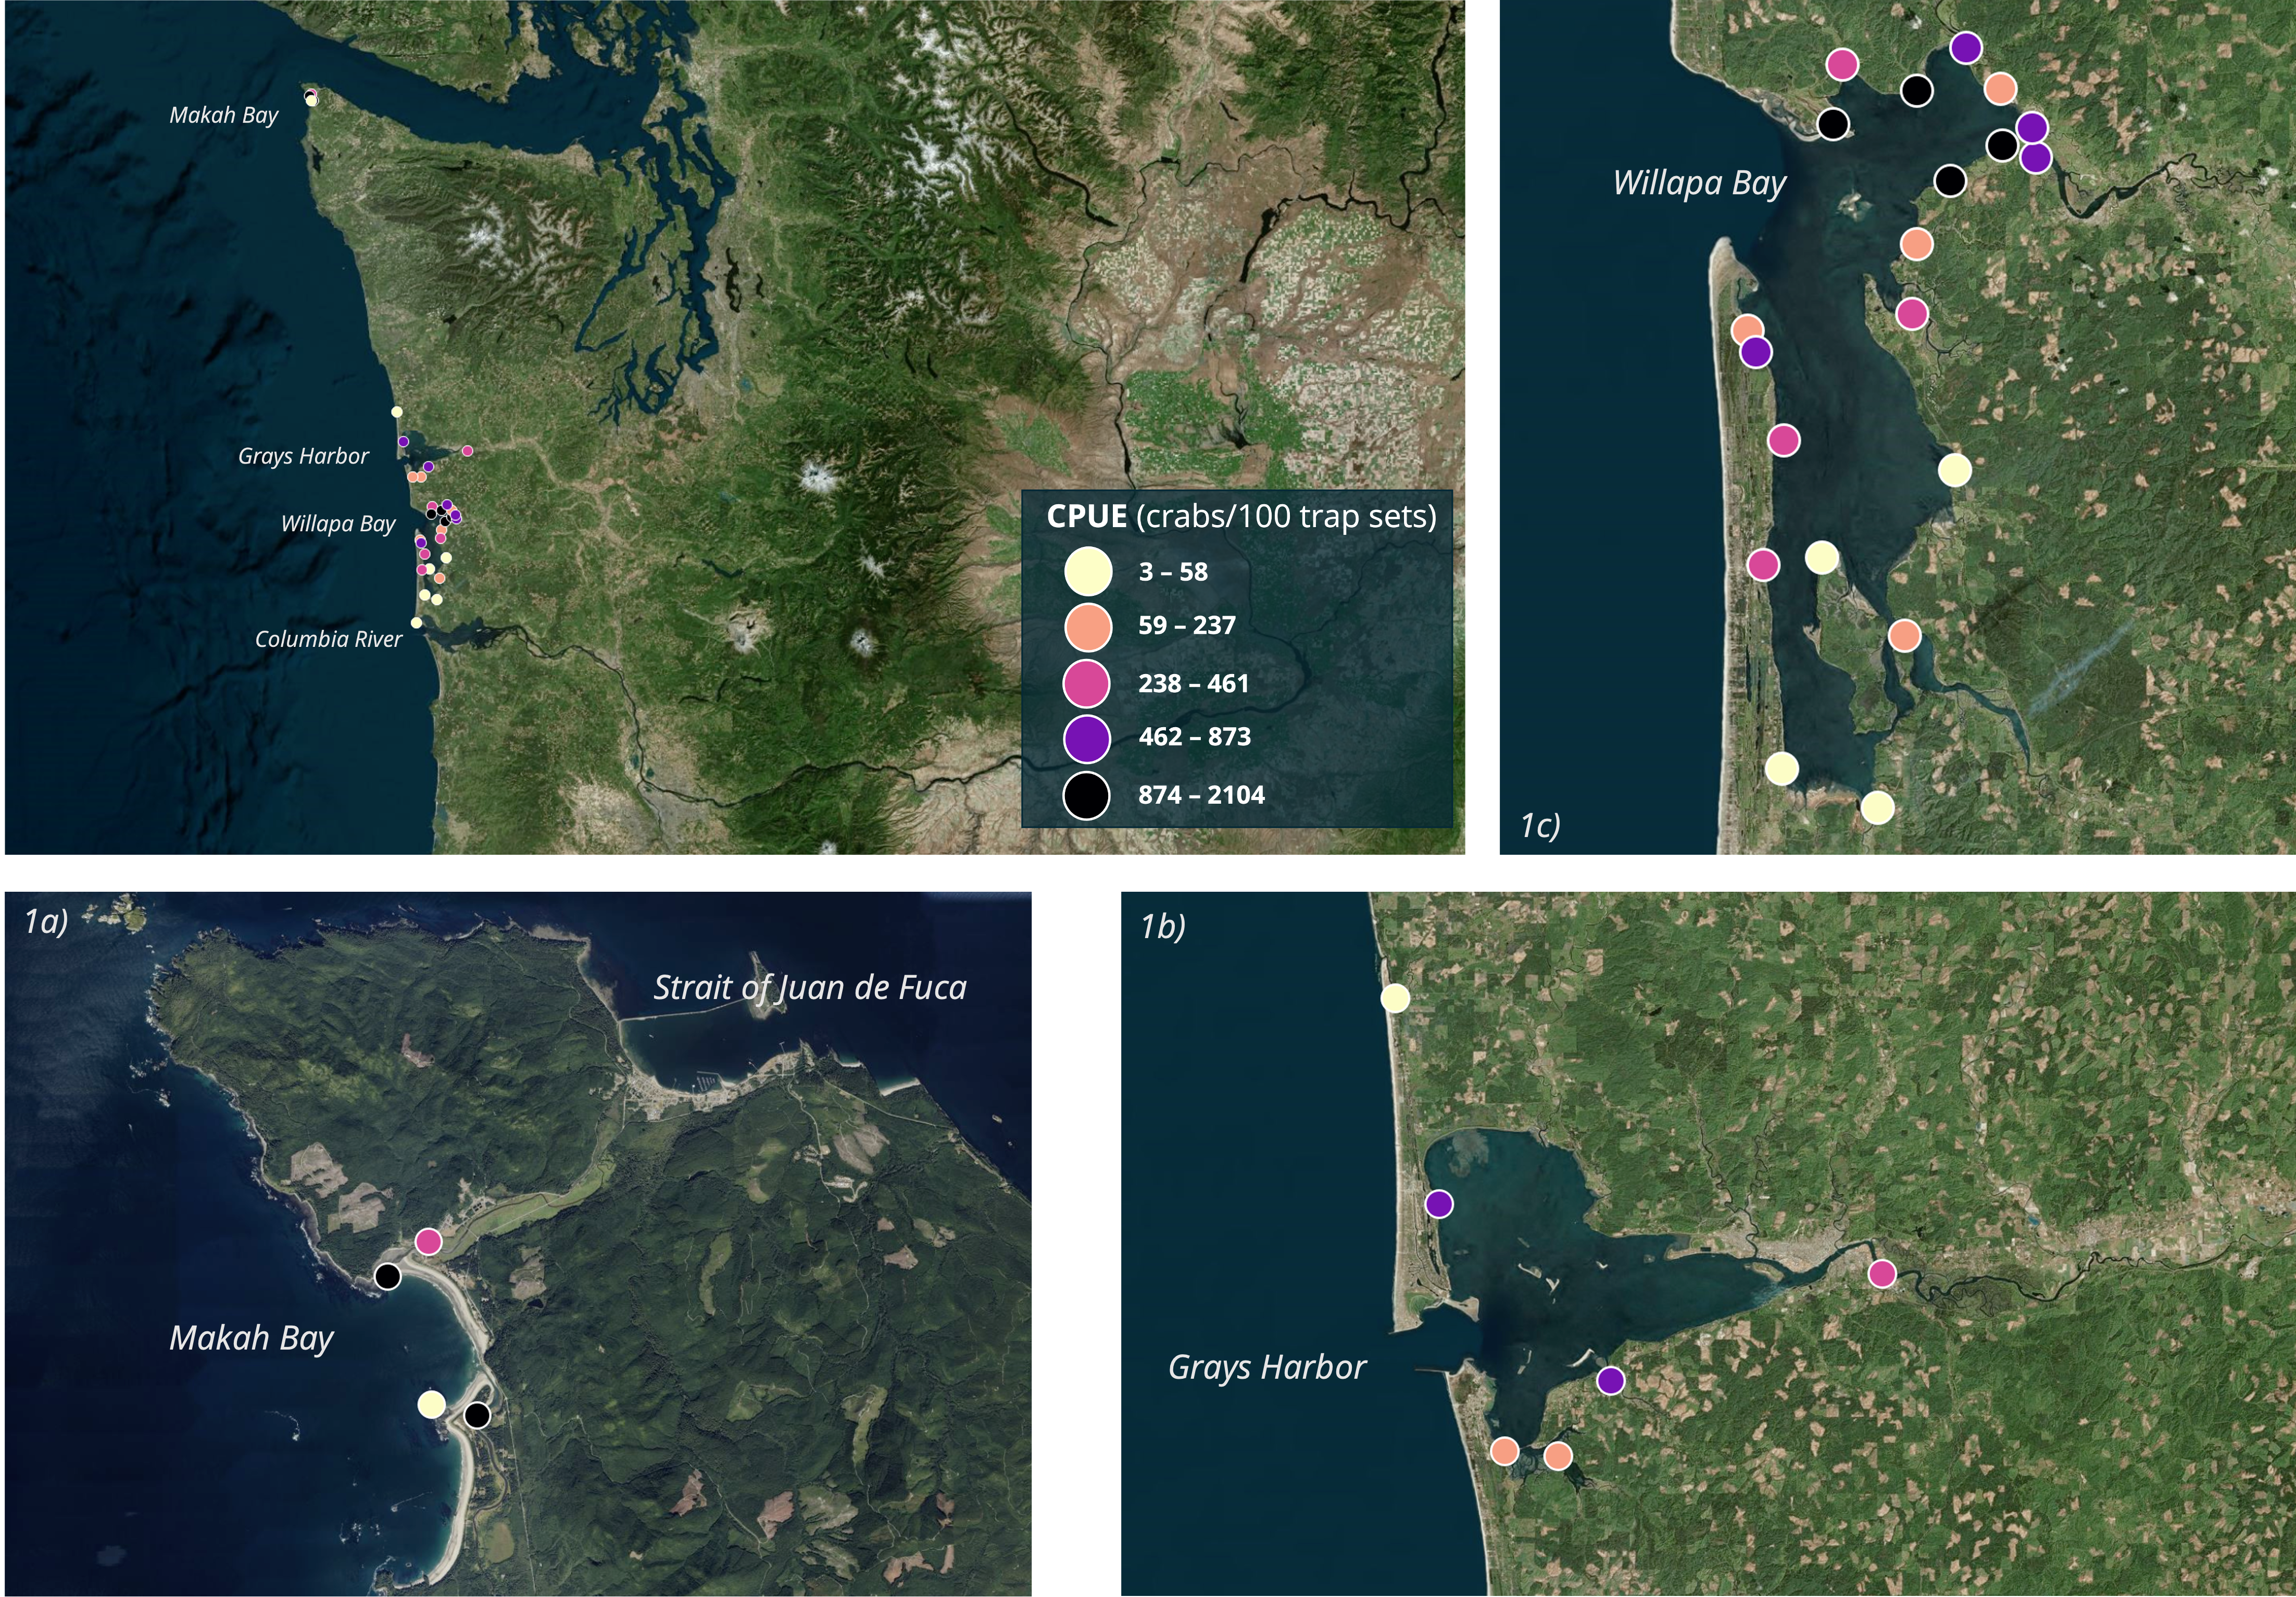
Figure 1. Average annual catch-per-unit-effort (number of crabs per 100 trap sets) at coastal sites where standardized data is available from 2022. Figs. 1a-c) show a closer look at Makah Bay, Grays Harbor, and Willapa Bay, respectively. Data kindly shared by the Makah Fisheries Department, Pacific County Vegetation Management, the Shoalwater Bay Indian Tribe, and Washington Department of Fish and Wildlife.
Annual Trends
In 2022, partner groups were able to set more traps along Washington’s Pacific coast than ever before (+25,000 traps), resulting in the greatest number of green crabs removed on record (204,274 crabs, per WDFW data). The Makah Fisheries Department, Pacific County Vegetation Management, the Shoalwater Bay Indian Tribe Natural Resources Department, shellfish growers, WDFW, and the Willapa Bay National Wildlife Refuge led the charge in green crab removal on the coast. Average capture rates varied substantially between sites, ranging from 8 crabs per 100 traps set (Long Island) to 2,104 crabs per 100 traps set (Wa’atch Point) (Figure 1).
Changes in Abundance
Although calculating the true population size of green crabs remains a challenge, we estimate relative abundances and population trends using catch rates as a proxy. We also have to factor in the ways in which catch rates change that aren’t directly related to population size, including time of year and trap type. For this reason, monitoring data, including data from the Crab Team network of coastal sites, which are collected in the same way each year, give us the clearest way to compare changes in population size from one year to the next. However, monitoring efforts are typically only able to capture a small part of an overall site, so we try to build a bigger picture by also looking at data from “control” trapping efforts, where managers and partners set a greater number of traps repeatedly over a larger area to try to increase the scope and efficiency of drawing down the population (Table 1).
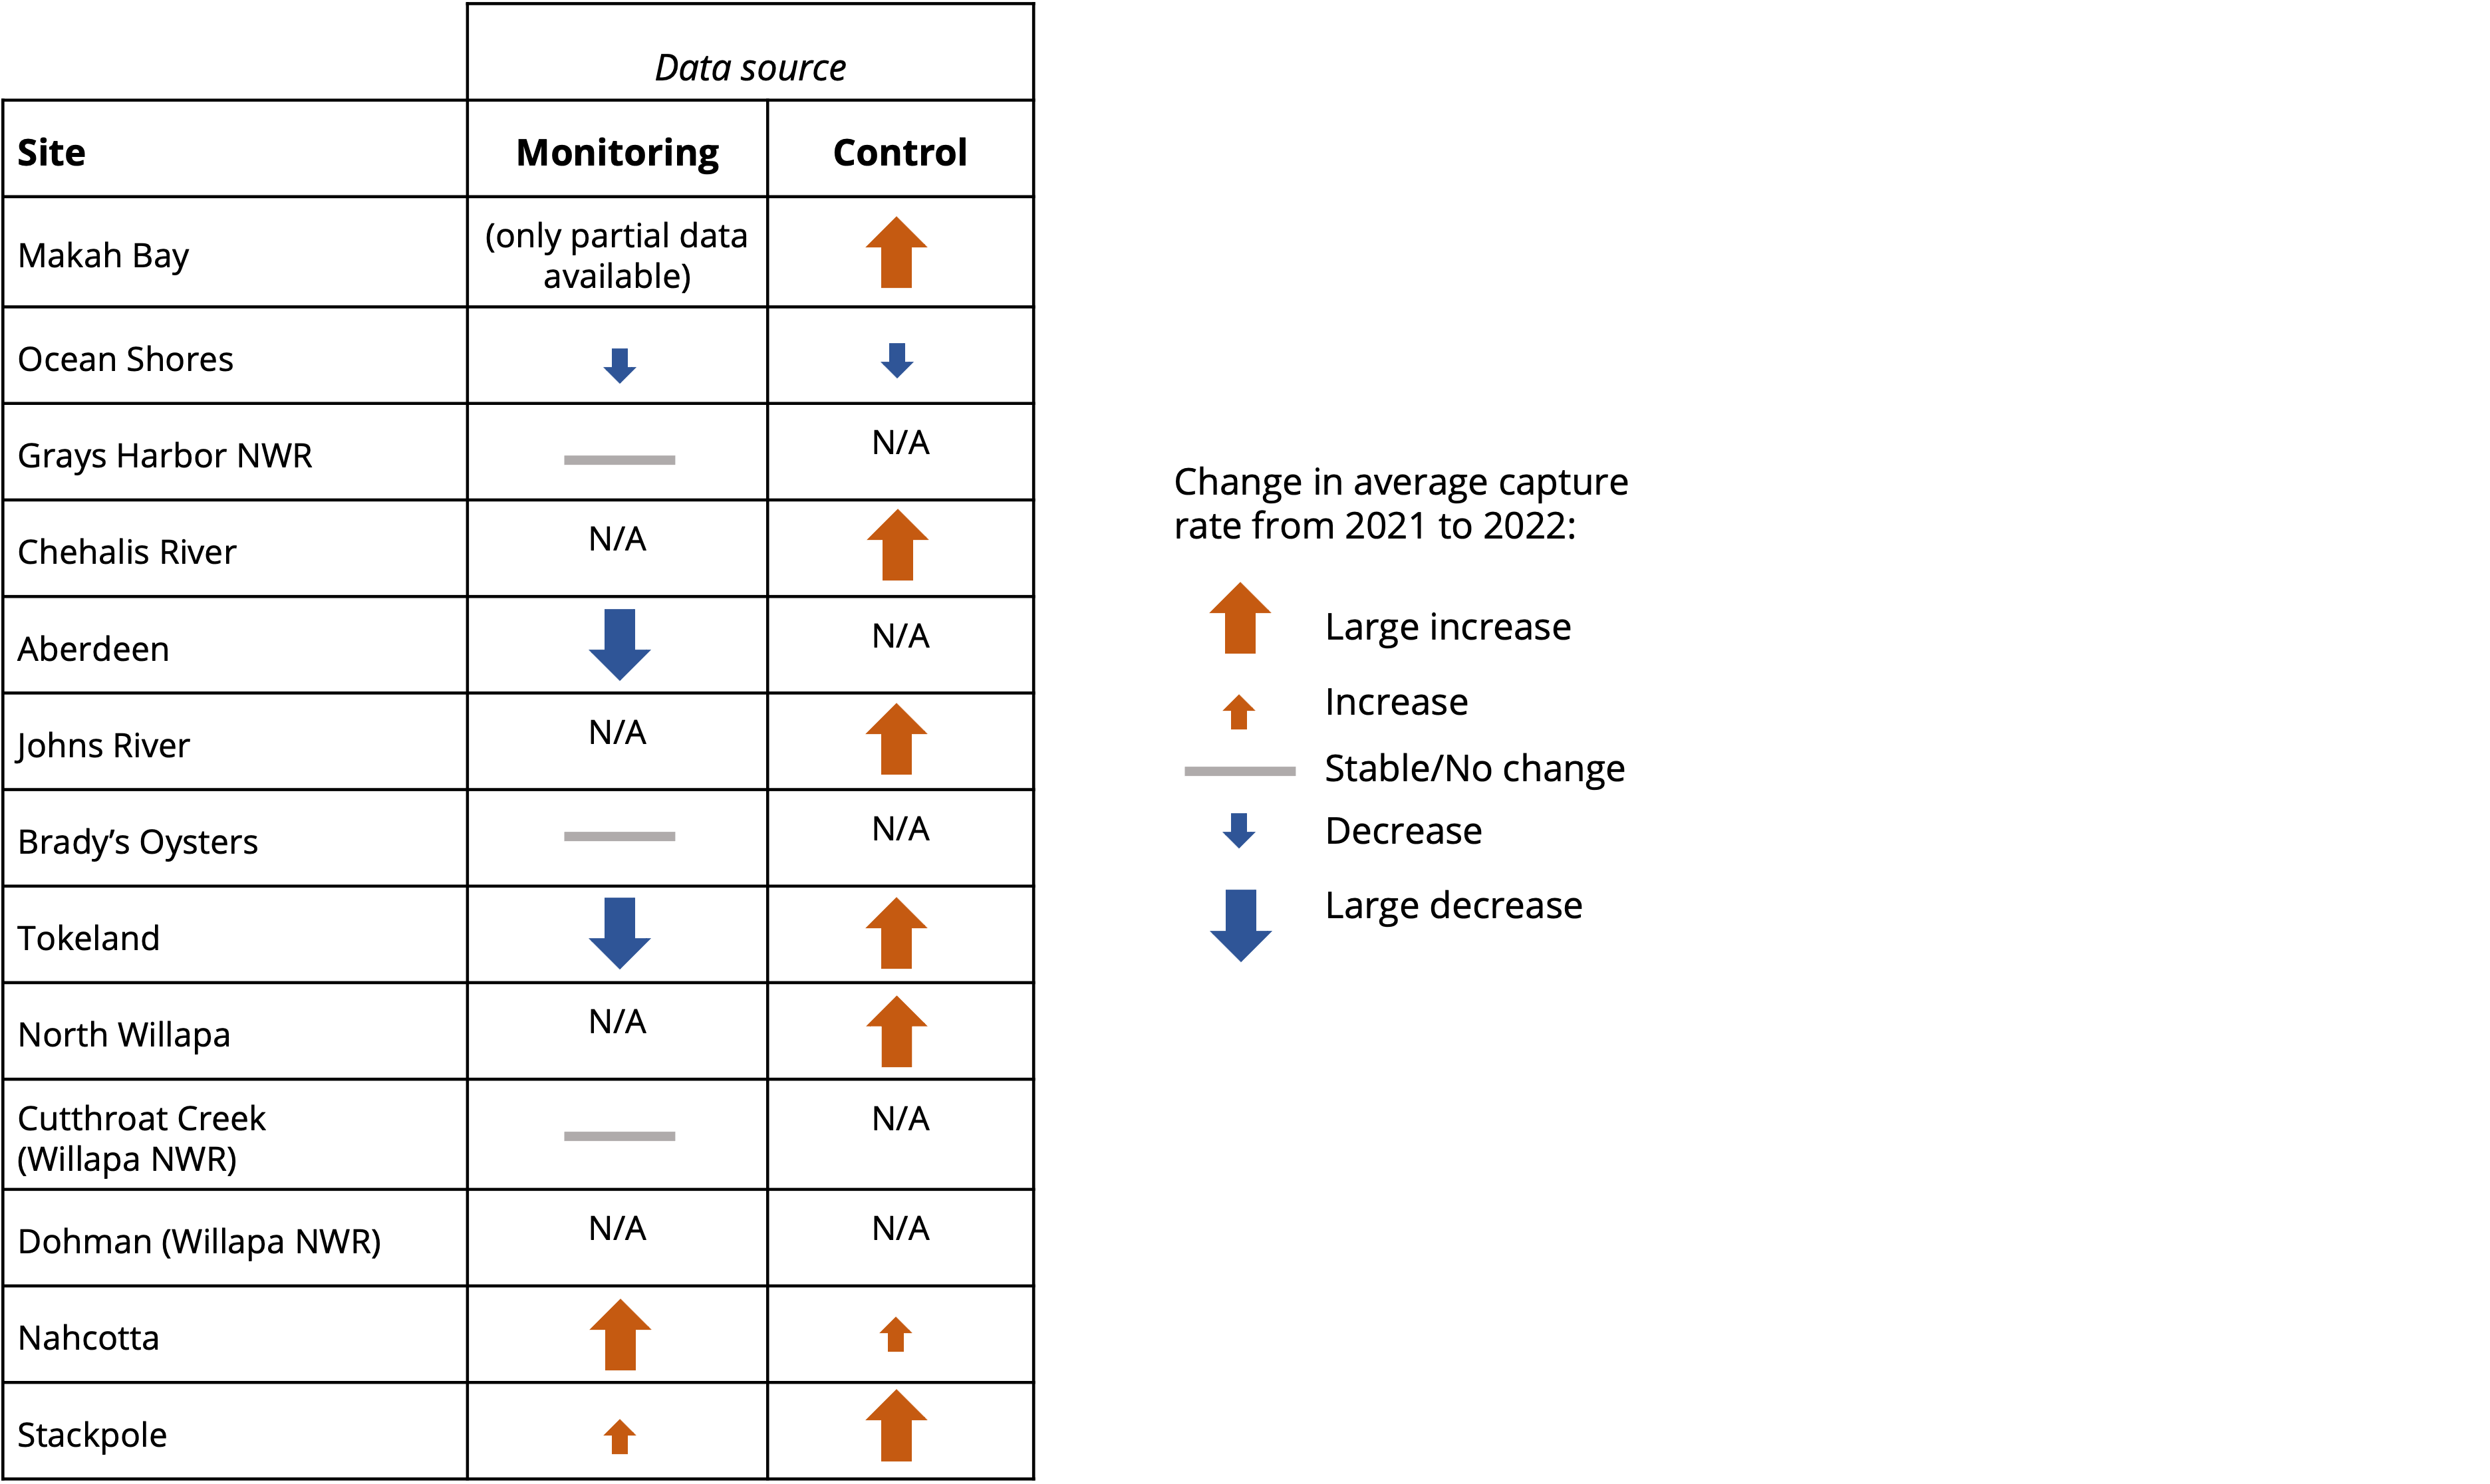
Table 1. Change in catch rates across coastal sites from 2021 to 2022 based on trapping effort type. N/A indicates that no trapping in that category occurred at a particular site in 2021 or 2022.
Trends in average catch rates varied at the site level and between years (Table 1). It’s rare for multiple types of effort to show the same trend due to differences in trapping protocols, so when we see the same trend across efforts, we have more confidence in a real trend. Clear trends emerged at three sites for which we have both monitoring and control data: Ocean Shores (Grays Harbor), the only site with a clear decrease, and Stackpole and Nahcotta (Willapa Bay), both of which showed a clear increase compared to 2021 (Table 1). One site (Tokeland, Willapa Bay) showed conflicting trends in monitoring vs. control data. One explanation could be that, because control trapping covers a lot more territory than monitoring efforts, discrepancies between the two types of data could relate to how crabs use the site relative to the larger water body. For example, in Tokeland, one channel is trapped as part of the monthly monitoring effort, and the population dynamics of that particular channel may not be reflective of population dynamics at the scale of the Tokeland peninsula as a whole. Another possibility is that control efforts are likely improving and/or increasing over time, leading to catch rates that are high relative to the true population size. As trapping groups become more skilled and efficient at trapping, they may observe capture rates increase partly because they’re catching more crabs with less effort.
These contrasting patterns underscore the complexities in trying to understand the fuller picture of changing green crab population dynamics when comparing catch rates from varied data sources. Considering other factors, such as crab biometrics (sex and size) and recruitment patterns, can help us better understand population dynamics at the site and estuary levels.
New Hotspots
A green crab “hotspot” is a site with a much higher abundance relative to other sites in a given region. Several sites emerged as new hotspots on the coast in 2022. The lower Chehalis River in Grays Harbor experienced the greatest year-to-year increase, making it a priority area for WDFW control efforts in 2023 (Table 1, Figure 1b). In Willapa Bay, new hotspots included Freshwater Creek, Carruthers/Willapa Meadows, and Bruceport (Figure 1c). These sites, located in the northern part of Willapa Bay, adjacent to Tokeland and close to the estuary’s mouth, are more susceptible to influxes of larvae from the Pacific Ocean.
Population Distribution
In Willapa Bay, the highest abundances of green crabs were found near the mouth and in the northern reaches of the bay, consistent with previous years (Figure 1). However, a shift in distribution was observed in Grays Harbor. In 2022, the largest populations were evenly distributed throughout the estuary, with hotspots identified at Ocean Shores, the southern reach of the Chehalis River, and Johns River.
Recruitment
Analyzing the size and sex of captured crabs helps determine their life stage and understand recruitment patterns. Data from various organizations, including the Makah Tribe, Shoalwater Bay Indian Tribe, Pacific County Vegetation Management, WDFW, and the Crab Team monitoring sites managed by WSG, indicated that 2022 was a stronger recruitment year than 2021. For example, at WSG Crab Team coastal sites, young-of-the-year (YOY) captures made up approximately 13% of the total catch, which was about double of what was captured at these same sites the previous year. Sites closer to the Pacific Ocean, such as Makah Bay, the northern parts of Willapa Bay and the Long Beach Peninsula, stood out as high recruitment areas.
Seasonal Trends
The winter of 2022, influenced by La Niña, brought colder and wetter conditions that extended into spring. This was reflected in trapping data, with higher elevations (>+3 ft MLLW) showing relatively lower capture rates from March through June (Figure 2). Conversely, trapping at lower elevations (<+0 ft MLLW) around shellfish gear yielded higher catches during cooler months (November-March), as per Pacific Seafoods capture data. The greatest capture rates at higher elevations occurred between August and October, as green crabs migrated further up the channels with the warmer weather.
Gravid females were more prevalent in early spring, from January to early-mid May, while increased observations of mating pairs occurred in late fall (Figure 2). Gravid females and mating pairs are typically found in areas with high population abundances, though they can also occur in regions with lower abundances less frequently.
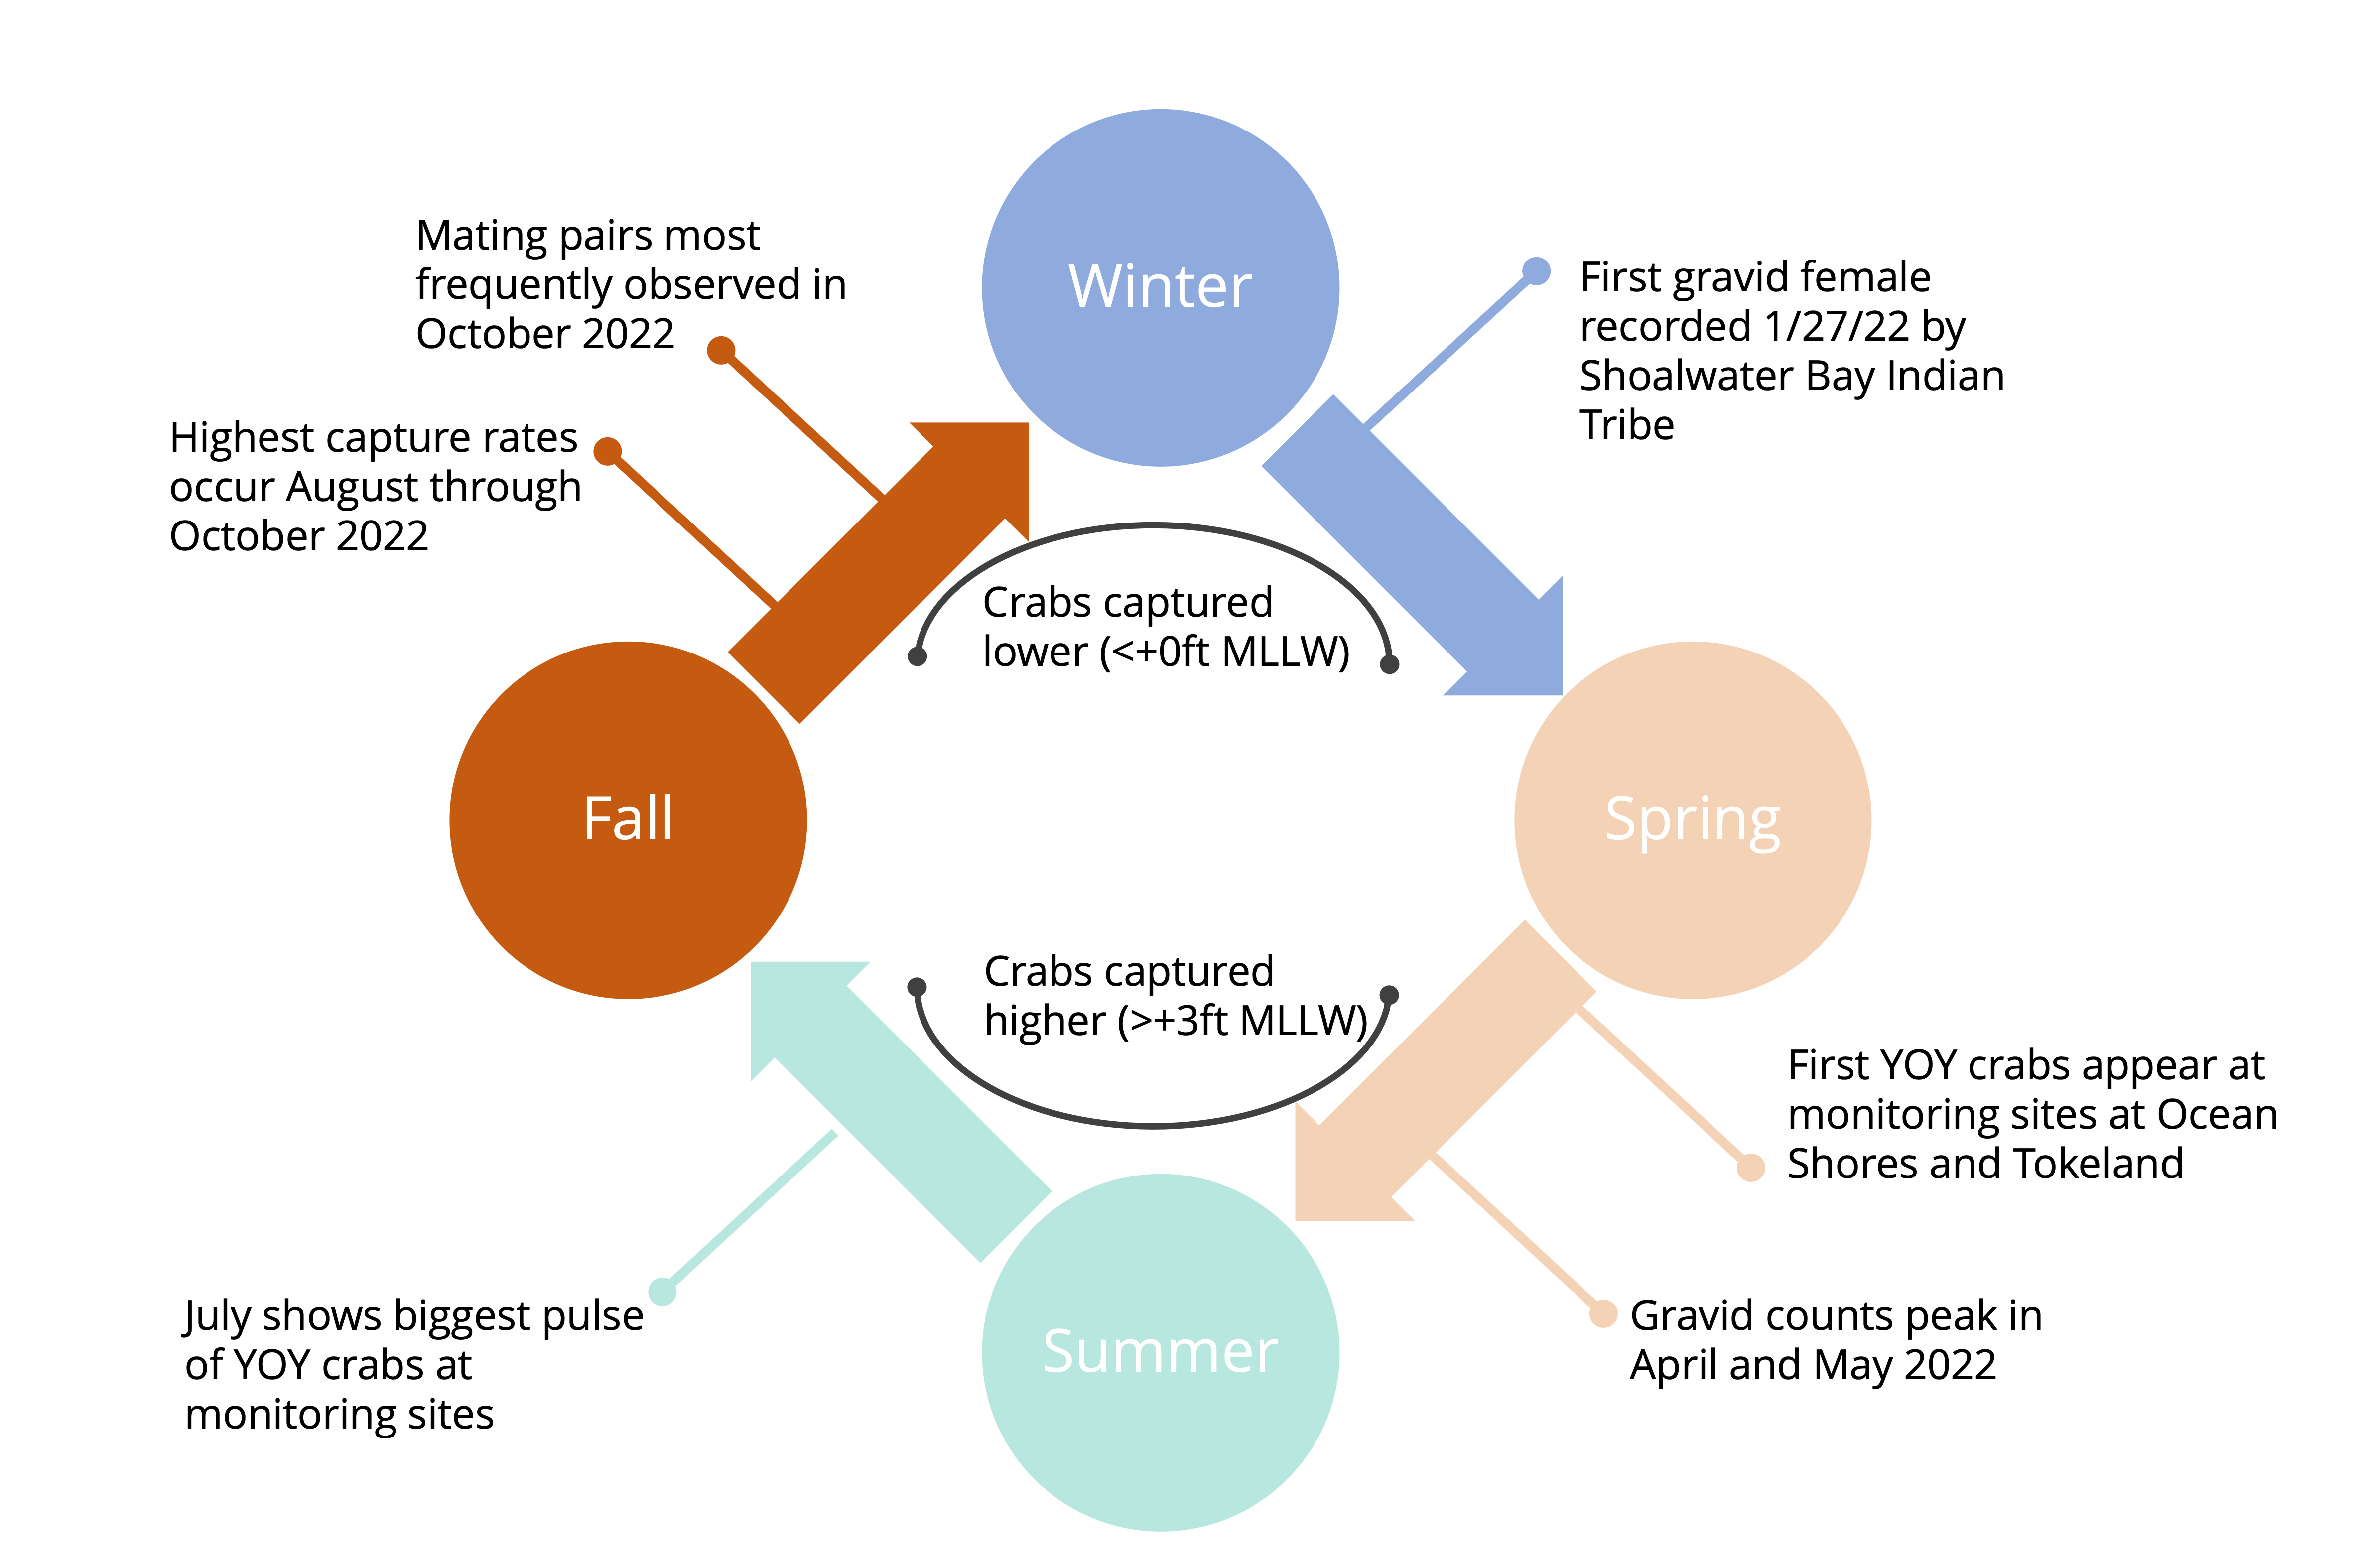
Figure 2. Seasonal patterns of green crab captures. The cooler winter months produced higher catch rates at lower elevations, and gravid female captures spiked in early spring. As temperatures warmed, green crabs moved higher up the intertidal, and young-of-the-year (YOY) crabs began to appear in traps more frequently.
Acknowledgements
The 2022 trapping season on the Washington coast provided valuable insights into European green crab expansion into fringe habitats, changes in abundance, new hotspots, population distribution, recruitment patterns, and seasonal trends. This work is deeply collaborative, and the network of dedicated trappers grows every year. We are grateful for our partnerships, and would like to thank and acknowledge each group that contributed their expertise, time, and talent to green crab control and monitoring in 2022: Brady’s Oysters, Coastal Interpretive Center, Grays Harbor National Wildlife Refuge, Grays Harbor Stream Team, Makah Tribe, Pacific Conservation District, Pacific County Vegetation Management, Pacific Shellfish/Pacific Seafoods, Quileute Tribe, Shoalwater Bay Indian Tribe, Taylor Shellfish, Washington Department of Fish and Wildlife, Willapa Bay Shellfish, Willapa-Grays Harbor Oyster Growers Association (representing 9+ farms who trapped this year), and the Willapa National Wildlife Refuge.
By analyzing data from various sources, agencies, tribes and researchers can gain a better understanding of the dynamics and impacts of green crabs in Washington’s coastal ecosystems. As we move forward into the 2023 trapping season, these findings can be used to guide targeted control efforts and further research to mitigate the invasive species’ impact on important resources, native biodiversity and ecosystems.
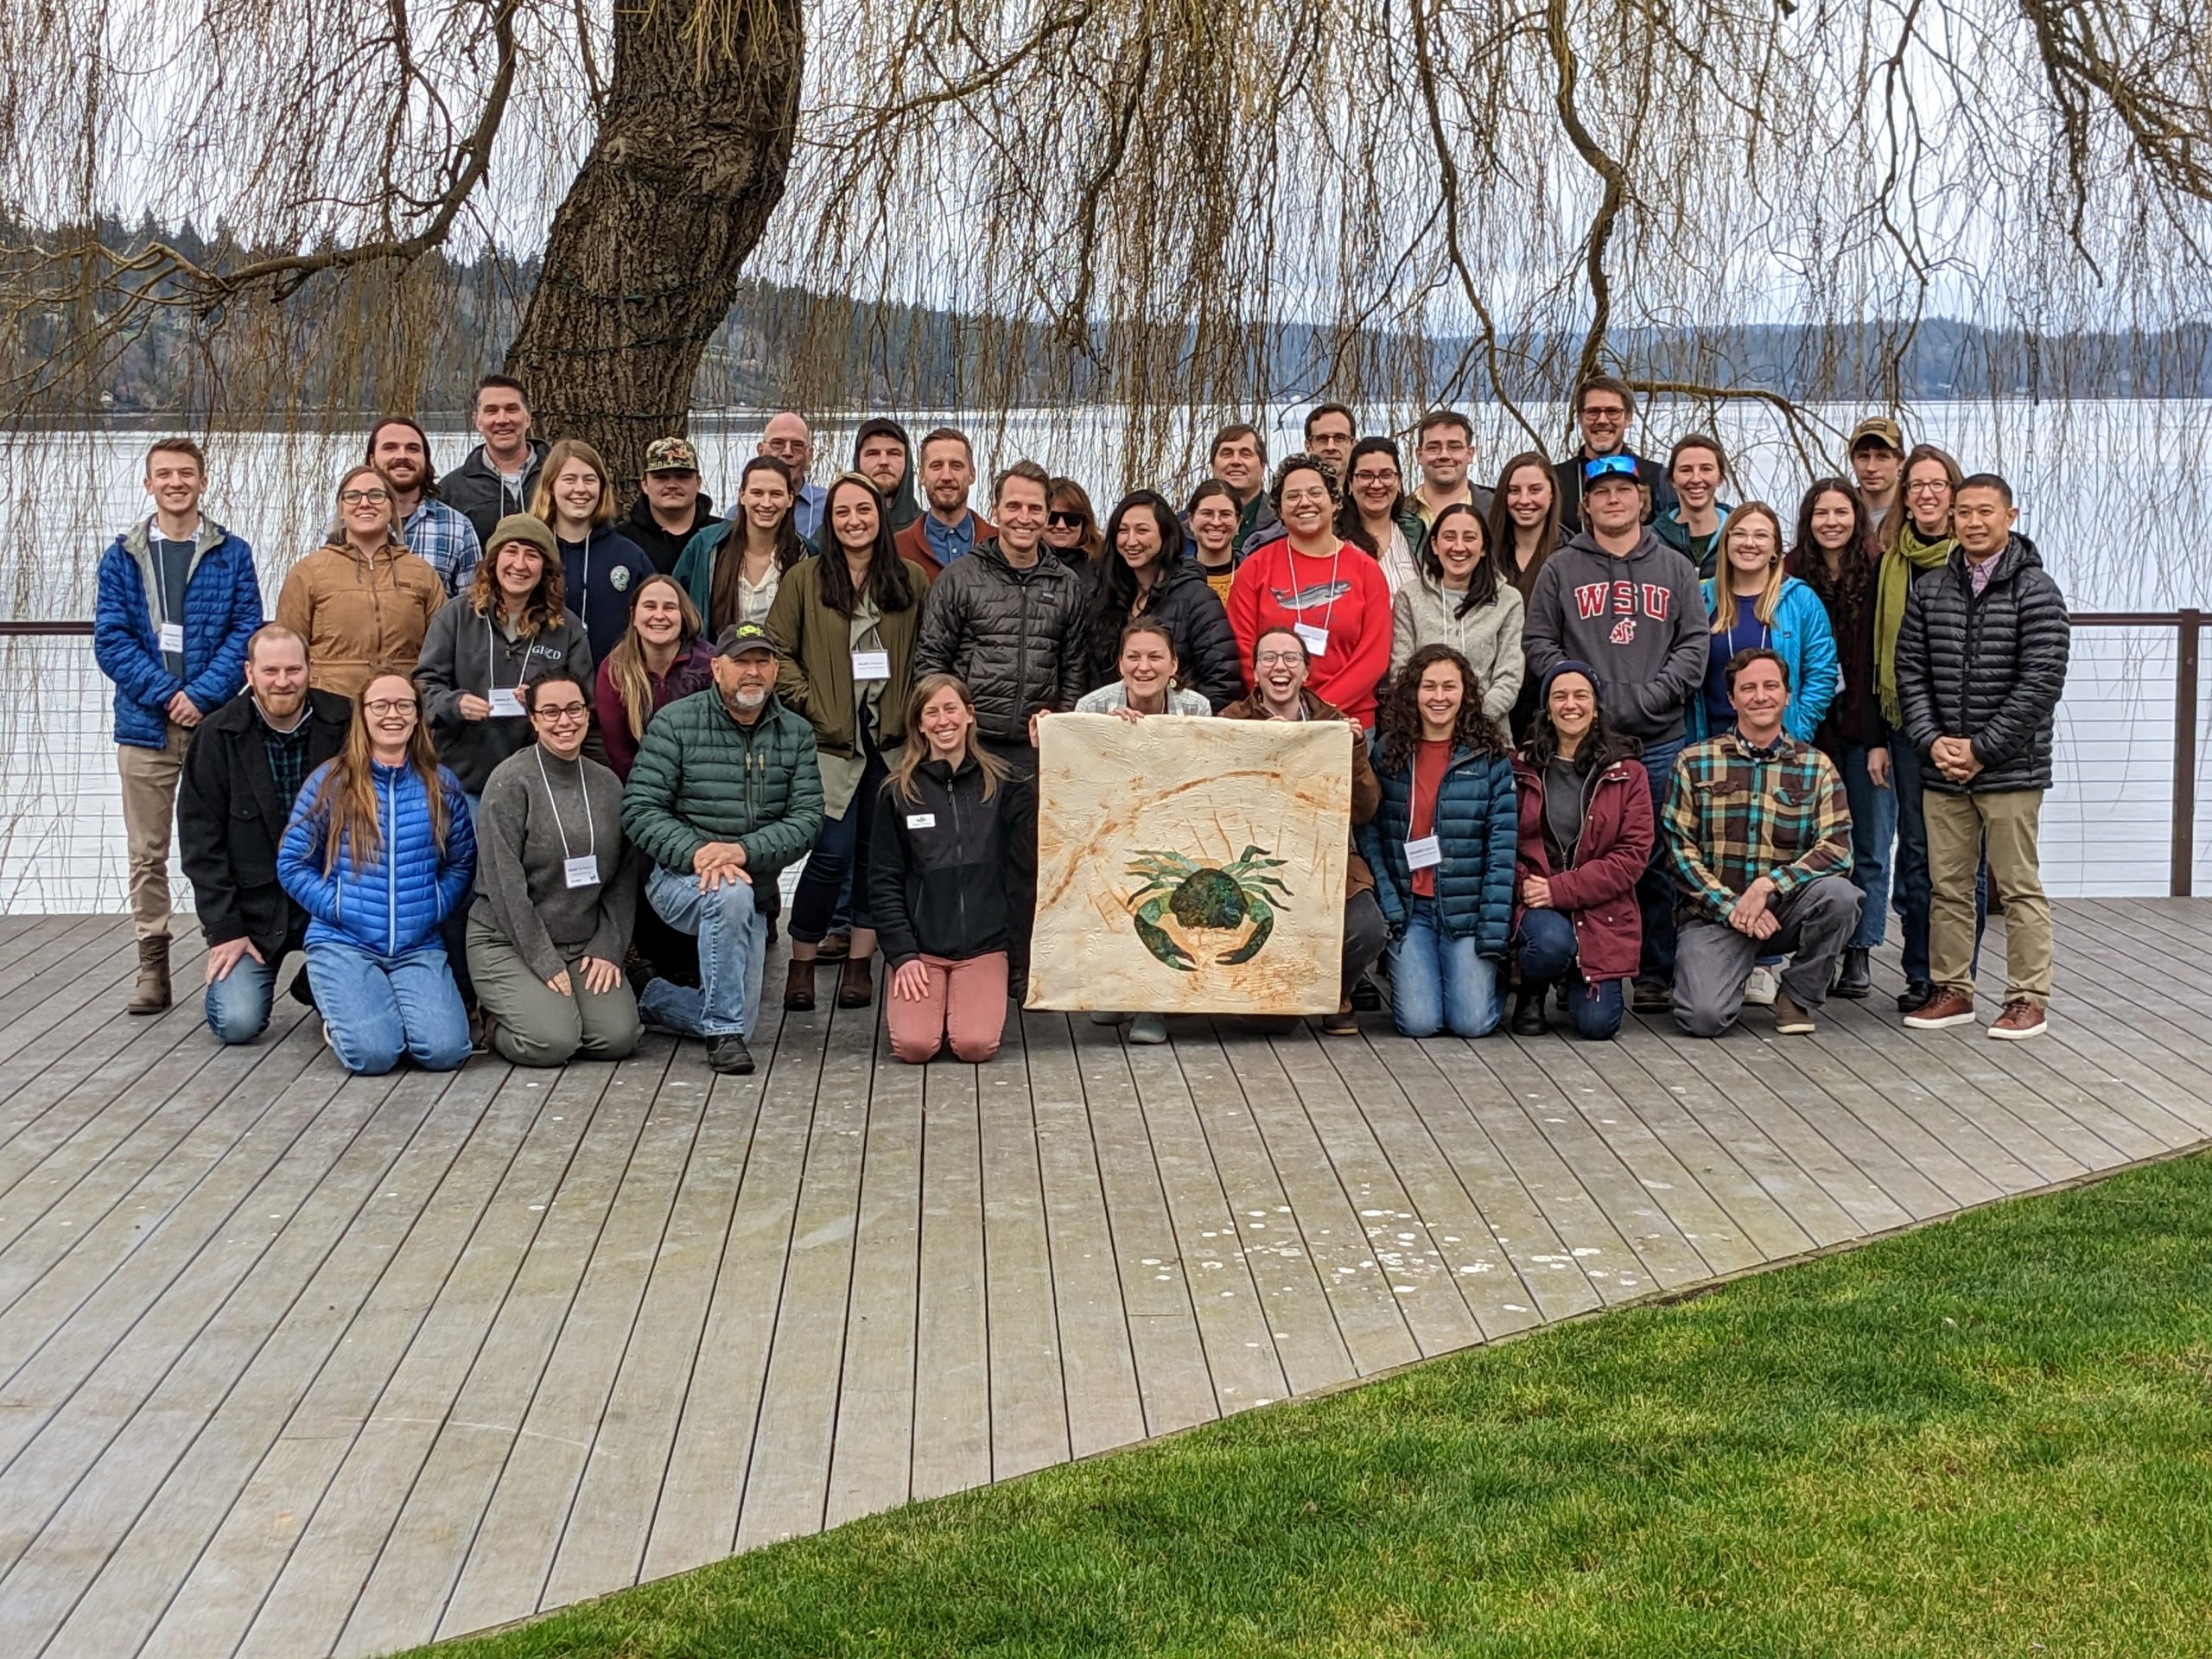
Caption: Trappers from across western Washington gathered at the 2023 Trappers’ Summit, hosted by WSG, to share their trapping results and insights from the 2022 trapping season.
-Alex Stote, Ben Rubinoff, and Emily Grason
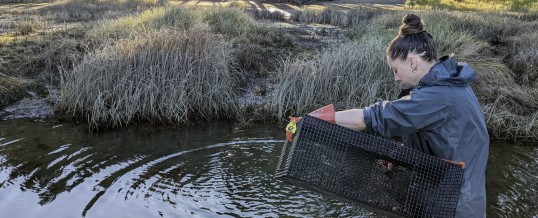
Header Image: Annie Cavanaugh (Makah Fisheries Department) retrieves a shrimp pot on the Makah Reservation. Photo credit: Alex Stote
JUN
2023