One strength of the Crab Team protocol is that it enables us to confidently compare findings among sites, and track changes over time – even if different people are doing the sampling. With sampling on this scale, even the small steps can be important to what we learn from the data. Protocol in Focus allows us to expand on these details, and offer an opportunity to see all the behind-the-scenes planning that goes into methodology.
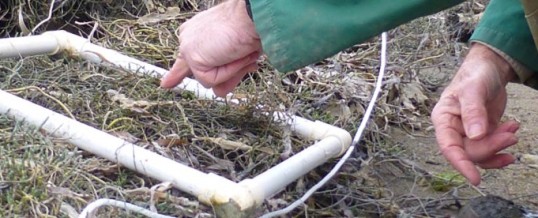
Of the three Crab Team protocols implemented at each site – trapping, molt hunt, and shoreline transect – only the first two actually involve looking for European green crabs. The shoreline transect protocol is designed to collect information about the sampling site itself, how much of it is anchored by vegetation, what the washed up debris (wrack) can tell us about the surrounding habitat, etc. Collected over time, this information could help us understand how habitat influences green crab, and vice versa. We know that green crab do well in pocket estuaries, but can we get more specific than that? Can we predict where green crab will show up and do well based on how much vegetation, or eelgrass, or trash is present? Or, can we see changes in the vegetation, or eelgrass, as a result of green crab population growth? By comparing sites with and without green crabs, before and after arrival, we could start to disentangle the relationships with habitat factors that could help us prioritize other sites for protection.
One question that has come up a few times is, “The shoreline doesn’t change much over the course of six months. Could we just do the survey once per year?” We agree that, particularly during relatively calm summer months, shoreline features don’t often change dramatically, so you can start to feel some déjà vu in taking observations each month over the same stretch of shoreline.
We do the survey monthly because, just as on land, conditions in the intertidal environment change throughout the season:
- Nutrients: Winter storms stir up the water, and strong river flows bring an abundance of nutrients to the nearshore and surface waters of estuaries. In spring, longer, warmer days in nutrient-rich water allow booms in growth of the marine organisms that rely on photosynthesis: phytoplankton, seaweeds, and eelgrass. But as the nutrients get used up, growth slows.
- Wave energy: Winter storms, even in relatively quiet pocket estuaries, change the shape of the beach, and move large woody debris. You might notice that familiar beaches get steeper in the winter, and the sediment becomes coarser. That’s because bigger waves can move bigger sediment grains, stripping the beach of fine muds and sands. As the waves calm moving from spring to summer, smaller grain sizes settle out of the water, and beach slopes get shallower.
- Temperature: You’ve probably noticed that during the summer the lower-low tides are conveniently (for curious beachgoers) timed in the middle of the day. The coincidence of the warmest, driest, sunniest days of the year, with the longest periods of exposure for intertidal habitat can be extraordinarily stressful for both plants and animals that live on the shoreline.
There is good reason to expect that these seasonal changes could affect the habitats we are tracking. For instance, in late summer, we might expect to see more barnacles and mussels dying from heat or long exposure to the air. We might also expect that we see more evidence of ‘primary production’ (growth by photosynthesizing organisms like eelgrass, seaweed) in the earliest months of sampling. We might even detect a shift from sand to mud.
Green crab could alter not only the habitat itself, but also the seasonal patterns in the habitat. For instance, in a typical year, we might see the percent cover of epifauna start to drop in July. But green crab looking for a meal could reduce populations of barnacles and mussels earlier in the year. If we only recorded observations once, or even twice, a year on the habitat, we would very likely miss these changes. Monthly surveys give us more time points to identify whether there is a trend or directional change in features over the course of the seasons.
It’s important to note, however, that while these are our hypotheses, they very well might not be supported by our observations. To test them, we need data. We are just now digging into our first full season of transect data – and you are the first to see it! So, without further ado, the world premier of the 2016 Crab Team Shoreline Transect data:
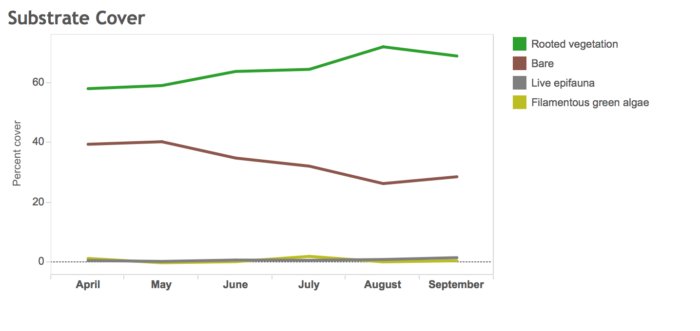
Substrate cover averaged across sites for each month of sampling during 2016.
The first figure (left) shows the percent cover of each of the four substrate cover categories, averaged over all of the sites for each month. You’ll notice that nearly all of the space is either bare or covered with vegetation, and that, on average, vegetation fills in about 16% more of the space in September than it did in April. Some of this increase is the sprouting of new seeds, filling in gaps, or the asexual growth of plants like grasses (e.g., Distichlis) that use rhizomes and runners to spread out and cover new territory. We might expect that over the winter, storms will remove some of this new growth, but we’ll have to wait until this spring to find out!
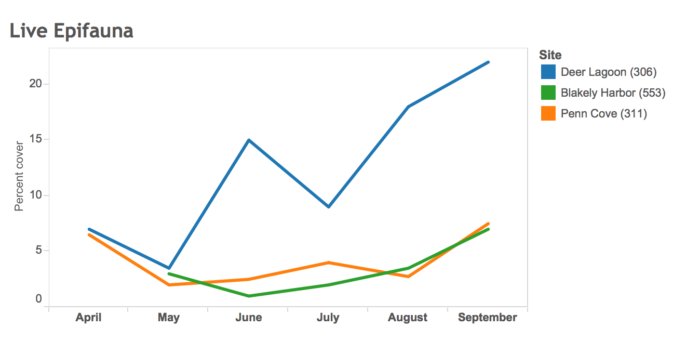
Percent cover of live epifauna for top three epifauna sites, averaged across 10 quadrats sampled for that site within each month.
Live epifauna (living animals attached or sitting in place) and filamentous green algae are two categories we added in 2016. They are both rare, but present at some sites. A stronger test of our hypotheses about seasonal trends in cover of live epifauna would be to zoom in on sites that actually have some of that category. At right, I selected the three sites with the most live epifauna and am showing the percent cover (averaged across the 10 quadrats) of that category only for each site. The original hypothesis was that live epifauna would decrease over the season due to stress of daytime low tides. None of the sites show this trend. Blakely Harbor and Penn Cove show a possible, if weak, “U-shaped” trend, and Deer Lagoon shows a marked increase in cover of live epifauna. This increase could be due either to population or individual growth, more mussels and barnacles, or bigger mussels and barnacles.
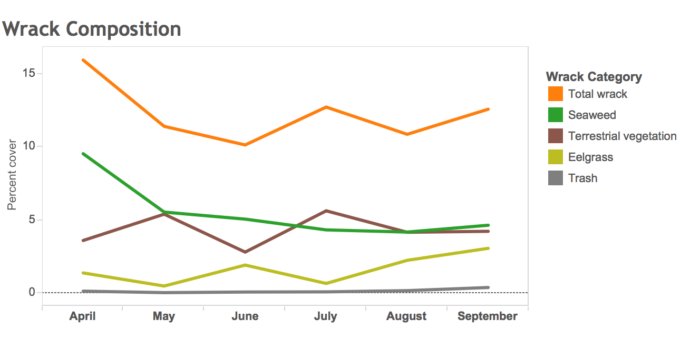
Percent cover of wrack categories, and total wrack cover, averaged across all sites during 2016.
What about the wrack? The amount of wrack observed at the sites was highest in April, and that was mostly due to an abundance of washed up seaweed during that month. This does support our prediction of a spring “bloom” of photosynthetic growth. We don’t see the same trend in eelgrass in the wrack, however, and that is probably because eelgrass is growing at that time, but staying rooted in the deeper areas. If we were to conduct our surveys during the winter, after the migratory brandt come through to graze on eelgrass, and when storm waves break the long blades, we would probably see much more eelgrass in the wrack. One positive note from these observations is that trash was very rare at all of the sites. Is it possible the very slight uptick in September is the accumulated debris of many summer vacations?
Sometimes, very small changes that happen over the course of several months aren’t apparent to our eyes alone. That is a major advantage of our large data set. When these small changes are aggregated over all of the sites, they become more obvious, and our conclusions about them more robust.
As we gather more data about shoreline habitats, we’ll have a better idea of which aspects show seasonal change, and how often we truly need to sample to capture those changes. We can then use that knowledge to assess whether we could simplify the transect protocol, and still be confident that we weren’t losing the ability to detect changes. We are grateful for the contributions of Crab Team volunteers in helping build a monitoring program founded on robust and well-tested methodologies, ultimately advancing the goals and impacts of citizen science.
-Emily Grason
Thanks for all the great questions and ideas. Please keep them coming, it helps us strengthen our monitoring and training to have your feedback and questions. Check out our FAQ in the Volunteer Toolbox for more protocol questions.
Return to News page.
Return to Crab Team home page.
Follow @WAGreenCrab
FEB
2017