November 21, 2017
One strength of the Crab Team protocol is that it enables us to confidently compare findings among sites, and track changes over time – even if different people are doing the sampling. With sampling on this scale, even the small steps can be important to what we learn from the data. Protocol in Focus allows us to expand on these details, and offer an opportunity to see all the behind-the-scenes planning that goes into methodology.
At the end of September, as you put the hard copies of your data sheets in the mail to us here at Crab Team HQ, you might rightly have wondered: what happens to all this information I’ve gathered? Nearly all sites have no data on European green crab, so what do we do with it? Does it just go in the “circular file”?
To answer these questions, we decided to daylight a bit of the sausage-making process: Crab Team data lifecycle. It’s not the flashiest topic, we realize. But giving you insight into the care we take with your data felt like a good way to honor the contribution you make each month.
") The Data Debrief infographic demonstrates what a long and winding road every single crab, molt, fish, snail and filamentous green alga travels along from the time it’s pulled out of the mud to when it appears in a final publication or report of some kind. Our goal is that all the pinches, splashes, filled boots, and muddy cars you endure translate into positive impacts on Washington shorelines. There are many ways we hope to accomplish this goal, publishing peer-reviewed literature, “white-paper” reports to agencies and tribes, outreach to general audiences, direct sharing of data with peer user groups. All of these potential outlets require that we do due diligence to ensure the data are:
The Data Debrief infographic demonstrates what a long and winding road every single crab, molt, fish, snail and filamentous green alga travels along from the time it’s pulled out of the mud to when it appears in a final publication or report of some kind. Our goal is that all the pinches, splashes, filled boots, and muddy cars you endure translate into positive impacts on Washington shorelines. There are many ways we hope to accomplish this goal, publishing peer-reviewed literature, “white-paper” reports to agencies and tribes, outreach to general audiences, direct sharing of data with peer user groups. All of these potential outlets require that we do due diligence to ensure the data are:
- High quality – Reasonably free from errors, such as a 217mm HEOR, or a keel billed toucan (species code: RASU incidentally) in a trap;
- Verifiable – Supported by backup information, such as images and hard copies of the data sheets, and trap catches;
- Usable – in a format that is easy to be manipulated and likely to be stable over time;
- Accessible – findable and retrievable by those looking for it, not only Crab Team, but ultimately those outside the program;
That sure is a tall order when we’re collecting data from 52 sites and more than 225 monitors. Averaged across the whole program, each individual spent four hours per month working on Crab Team last year, and we want that time to have payoff for the places you are working, regardless of whether or not (hopefully not) you find European green crab at your site. In the citizen science community, one of the biggest barriers to data impact is skepticism over the quality of the data. Scientists who use volunteer-sourced data have to work hard to demonstrate the data are reliable, and this work has payoff in strengthening confidence in the findings yielded by the data. Crab Team implements a number of best practices that go above and beyond many programs, to strengthen the case that our data are trustworthy to best of our ability.
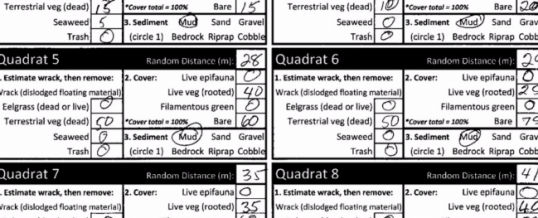
Data Review/Primary Validation: The team members who submit data monthly (Data Gurus, if you will) are very familiar with Crab Team process of revision and resubmission and deserve special accolades for withstanding Program Coordinator, Emily’s, …shall we say “rigorous evaluation” of the data submissions. This process involves checking the photos submitted against data sheets, verifying the data sheets are complete, and all questions are answered, and the finalized files are stored correctly. That’s right, with 52 sites, we review more than 300 trap photos each month, of literally thousands of critters. As many of you know, what with the glare, the mud, the wind, and the writhing sea life, it can be challenging to take photos in the field that show every individual clearly, so this can involve a bit of image adjustment to look at finer details. If there are questions, or gaps, Emily often requests that the data sheets or files be updated. This can seem tedious for a small point, but this saves our bacon, because the data sheets themselves are the Truth (with a capital T), and the images are used to enter data into the database, so consistency between the two is essential. By the end of the season, we will have roughly 1,000 image files of data sheets to keep organized and enter data from. We have a strong institutional memory here at Crab Team HQ, but we admit that by September, we don’t always remember what happened to the weird HEOR at site 232 in minnow trap 3 during April. Completing data sheets makes sure nothing is left out of posterity.
Data Entry/Storage: Certainly, transcribing data into spreadsheets is a big opportunity for errors to enter any project – not unique to Crab Team. Looking for oddballs and outliers that might be mistakes is an important part of cleaning up any dataset, but not, itself, error-proof. We’re excited that this part of our process will soon be changing for the better! We are currently working with a volunteer to build a relational database to store all of the gold (i.e. data) collected by Crab Team monitors. While the phrase “relational database” might not get you excited, Emily’s eyes widen every time she hears it. Rules built into the database should reduce the chance that impossible errors could be recorded as fact for all time (e.g. keel billed toucans in minnow traps). In time, we hope to create electronic data entry forms that will look like data sheets – speeding up data entry and reducing the chance that a trap gets recorded as a female instead of a Fukui, (or a male instead of a minnow – an unfortunate coincidence, really).
Once we are reasonably confident we have a reliable and complete dataset, we can start put the data itself to work! Some of this will be sharing the raw data directly, for instance, with the agencies and organizations that own or manage the monitoring sites. A number of our sites have recently had restoration work, or are part of a park system. The data then, can be used to enhance what is known about the state of these public trust resources, so we can share the data with these partners. We are also exploring the possibility of contributing these data to a repository like iNaturalist, or GBIF (Global Biodiversity Information Facility), some of the largest datasets globally that are used by scientists to learn about the state and trends of biodiversity worldwide.
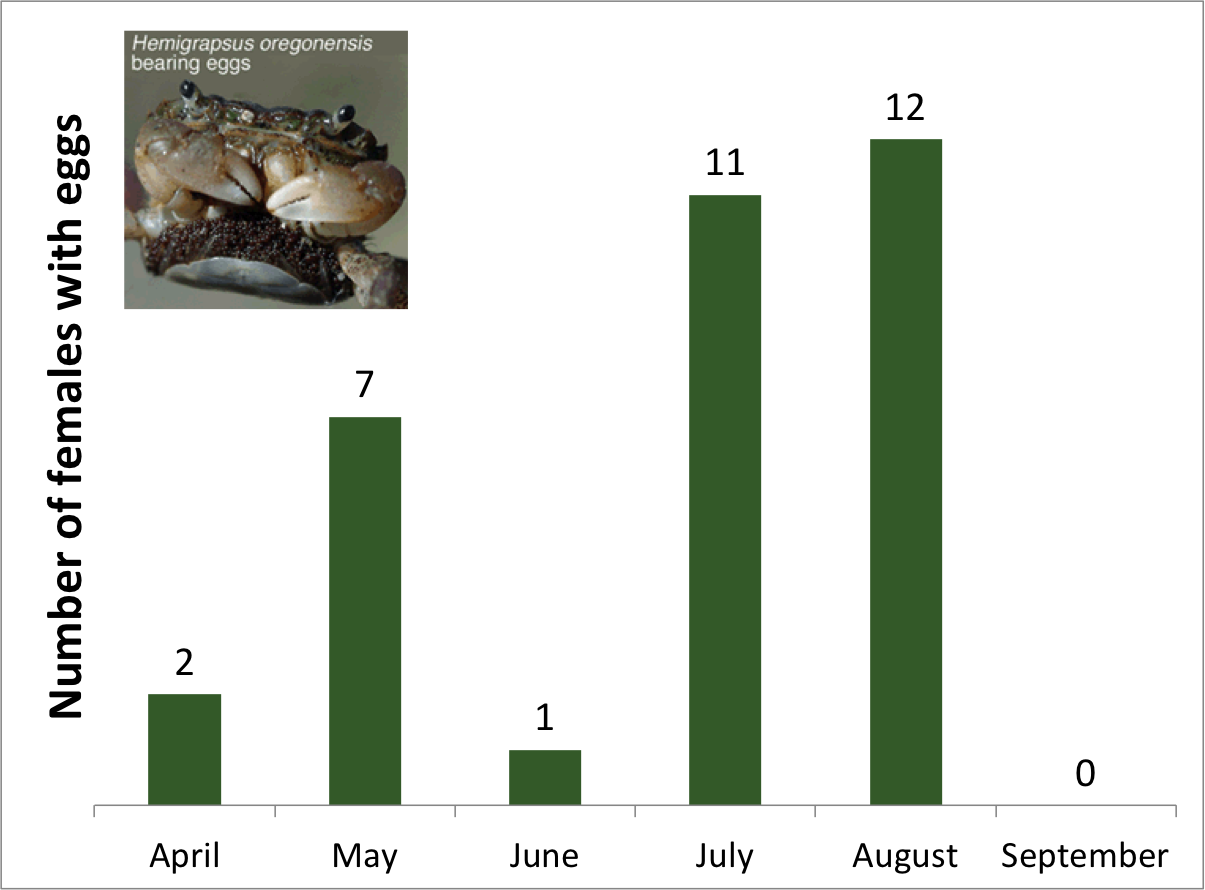
Of course, as a community of volunteers, partners and staff, Crab Team is closest to the mud, and we all have the most invested in what the data are telling us. So we are keen to dive in with our own fingers and try to answer questions about patterns over space and time. Where is diversity greatest? How do HEOR grow over the year? What are the most human-impacted sites? As we build the Crab Team dataset over time, the value of every crab measurement you take grows and can improve our understanding of and ability to manage shoreline habitats.
Sneak preview of data report. Shhh! Don’t tell! It will include maps, graphs, and tables of data YOU collected!
That’s why we are pleased as punch to announce that we will soon be releasing a 2016 data report. We wrote this specifically with our volunteers in mind, returning your investment by making sense of some of the big patterns at Crab Team Sites. We have previously released data as summary infographics (2015, 2016), which give a colorful snapshot of the Crab Team program each year. But this post will be written for those of you who feel like infographics are a bit of a tease. As Sean McDonald likes to say, in some cases Crab Team monitors are probably the only people to have ever collected scientific data from their sites, making you, the data collectors, pioneers in conservation of the Salish Sea.
–Emily Grason
NOV
2017