March 30, 2022
This is the third in a series of posts on a Crab Team project to develop environmental DNA (eDNA) for use in early detection and management of European green crab. The first posts provided an introduction to eDNA and the benefits and challenges it offers to invasion managers.
In developing eDNA as a useful way to detect and monitor invasive European green crab, there are two key challenges. First, what we might call developing “the assay.” An eDNA assay is a particular combination of sampling and analysis protocols. Just like you might find several recipes for a single dish, it’s not uncommon for more than one assay to be developed for a single species or purpose, and each might perform differently in different conditions. Second, it’s important to build an understanding of how to interpret the results of a particular assay. As the early use of eDNA with invasive carp in Lake Michigan demonstrated, even if the results are accurate, by themselves, they don’t always provide us with much guidance on what to do.
Assembling the Crab eDNA Team
To meet both these challenges, Crab Team was lucky to collaborate with several groups who have extensive eDNA experience, including the molecular genetics laboratory at Washington Department of Fish and Wildlife, and Ryan Kelly’s research group at the UW School of Marine and Environmental Affairs. Abby Keller joined the project as a graduate student, and took on this effort for her thesis because she wanted to use her background in genetics to improve the environmental management of invasive species. Abby thought green crab was a good case study for eDNA sampling because they are difficult to find just by walking around the shorelines, and because it can be hard to detect them at low abundance.
Abby started by working with an existing protocol for detecting green crabs via eDNA developed by researchers in Canada, and made adjustments so the molecular work was more reliable for local waters. But she also wanted to help managers think about how eDNA could be incorporated into “traditional” trapping methods of detection – that is, how can we combine information from both trapping and eDNA sampling to develop a stronger understanding of whether green crabs are present at a site? Both sampling methods are flawed; both have limitations on how much information they provide about the true status of green crabs (Figure 1). More information should be better, but when bringing together different types of information, the process of reconciling results can be less intuitive. For instance, when the results from these methods differ–say one method detects green crabs and the other does not–can we put a number on how confident (or how uncertain) we are about green crab presence? And could that confidence help us figure out what next steps might be in terms of management?
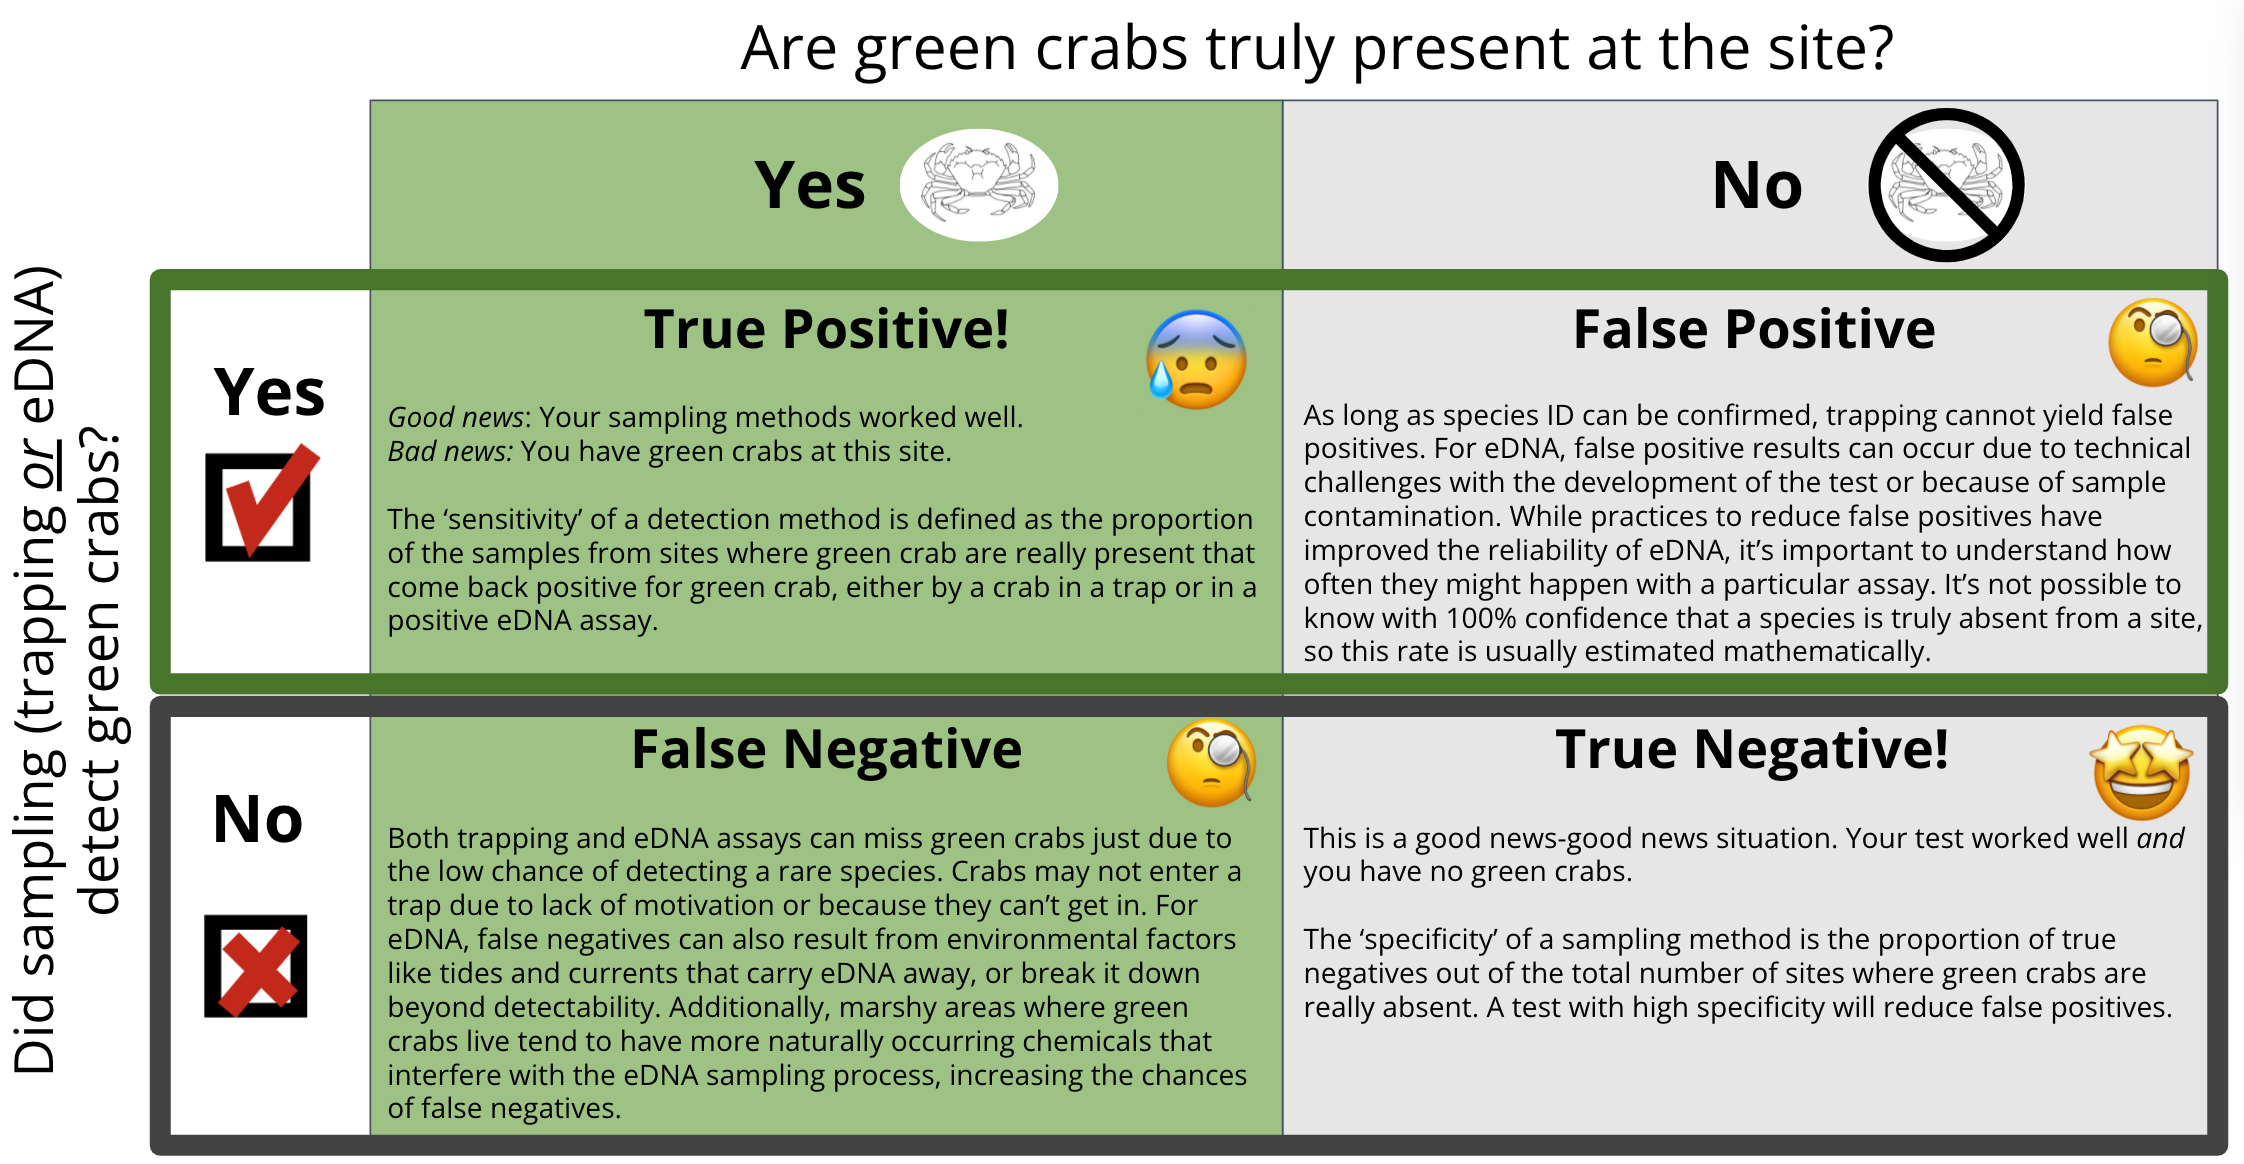
Figure 1. Schematic exploring scenarios where any given sampling technique, including either eDNA or traditional methods like trapping, might accurately or inaccurately detect green crabs at a site. Click to enlarge.
“eDNA Data, Meet Trapping Data”
To compare and combine results from eDNA and trapping surveys, it was necessary to get the data speaking the same language, and what better universal language than statistical probability? Abby developed a mathematical model to relate the density of green crabs observed during trapping surveys with the results of eDNA samples collected from the same locations at about the same time (Figure 2 – Map). Given the large and growing landscape of trapping activities across Washington, there were a lot of sites to choose from, and the list captured a range of green crab densities, from sites where green crabs have never been detected, to sites with some of the greatest abundances in the state. To do this, Abby was able to take advantage of the Crab Team monitoring network; she sampled several sites where trapping dating back seven years has never detected green crabs, thus giving us some confidence that green crabs are not present.
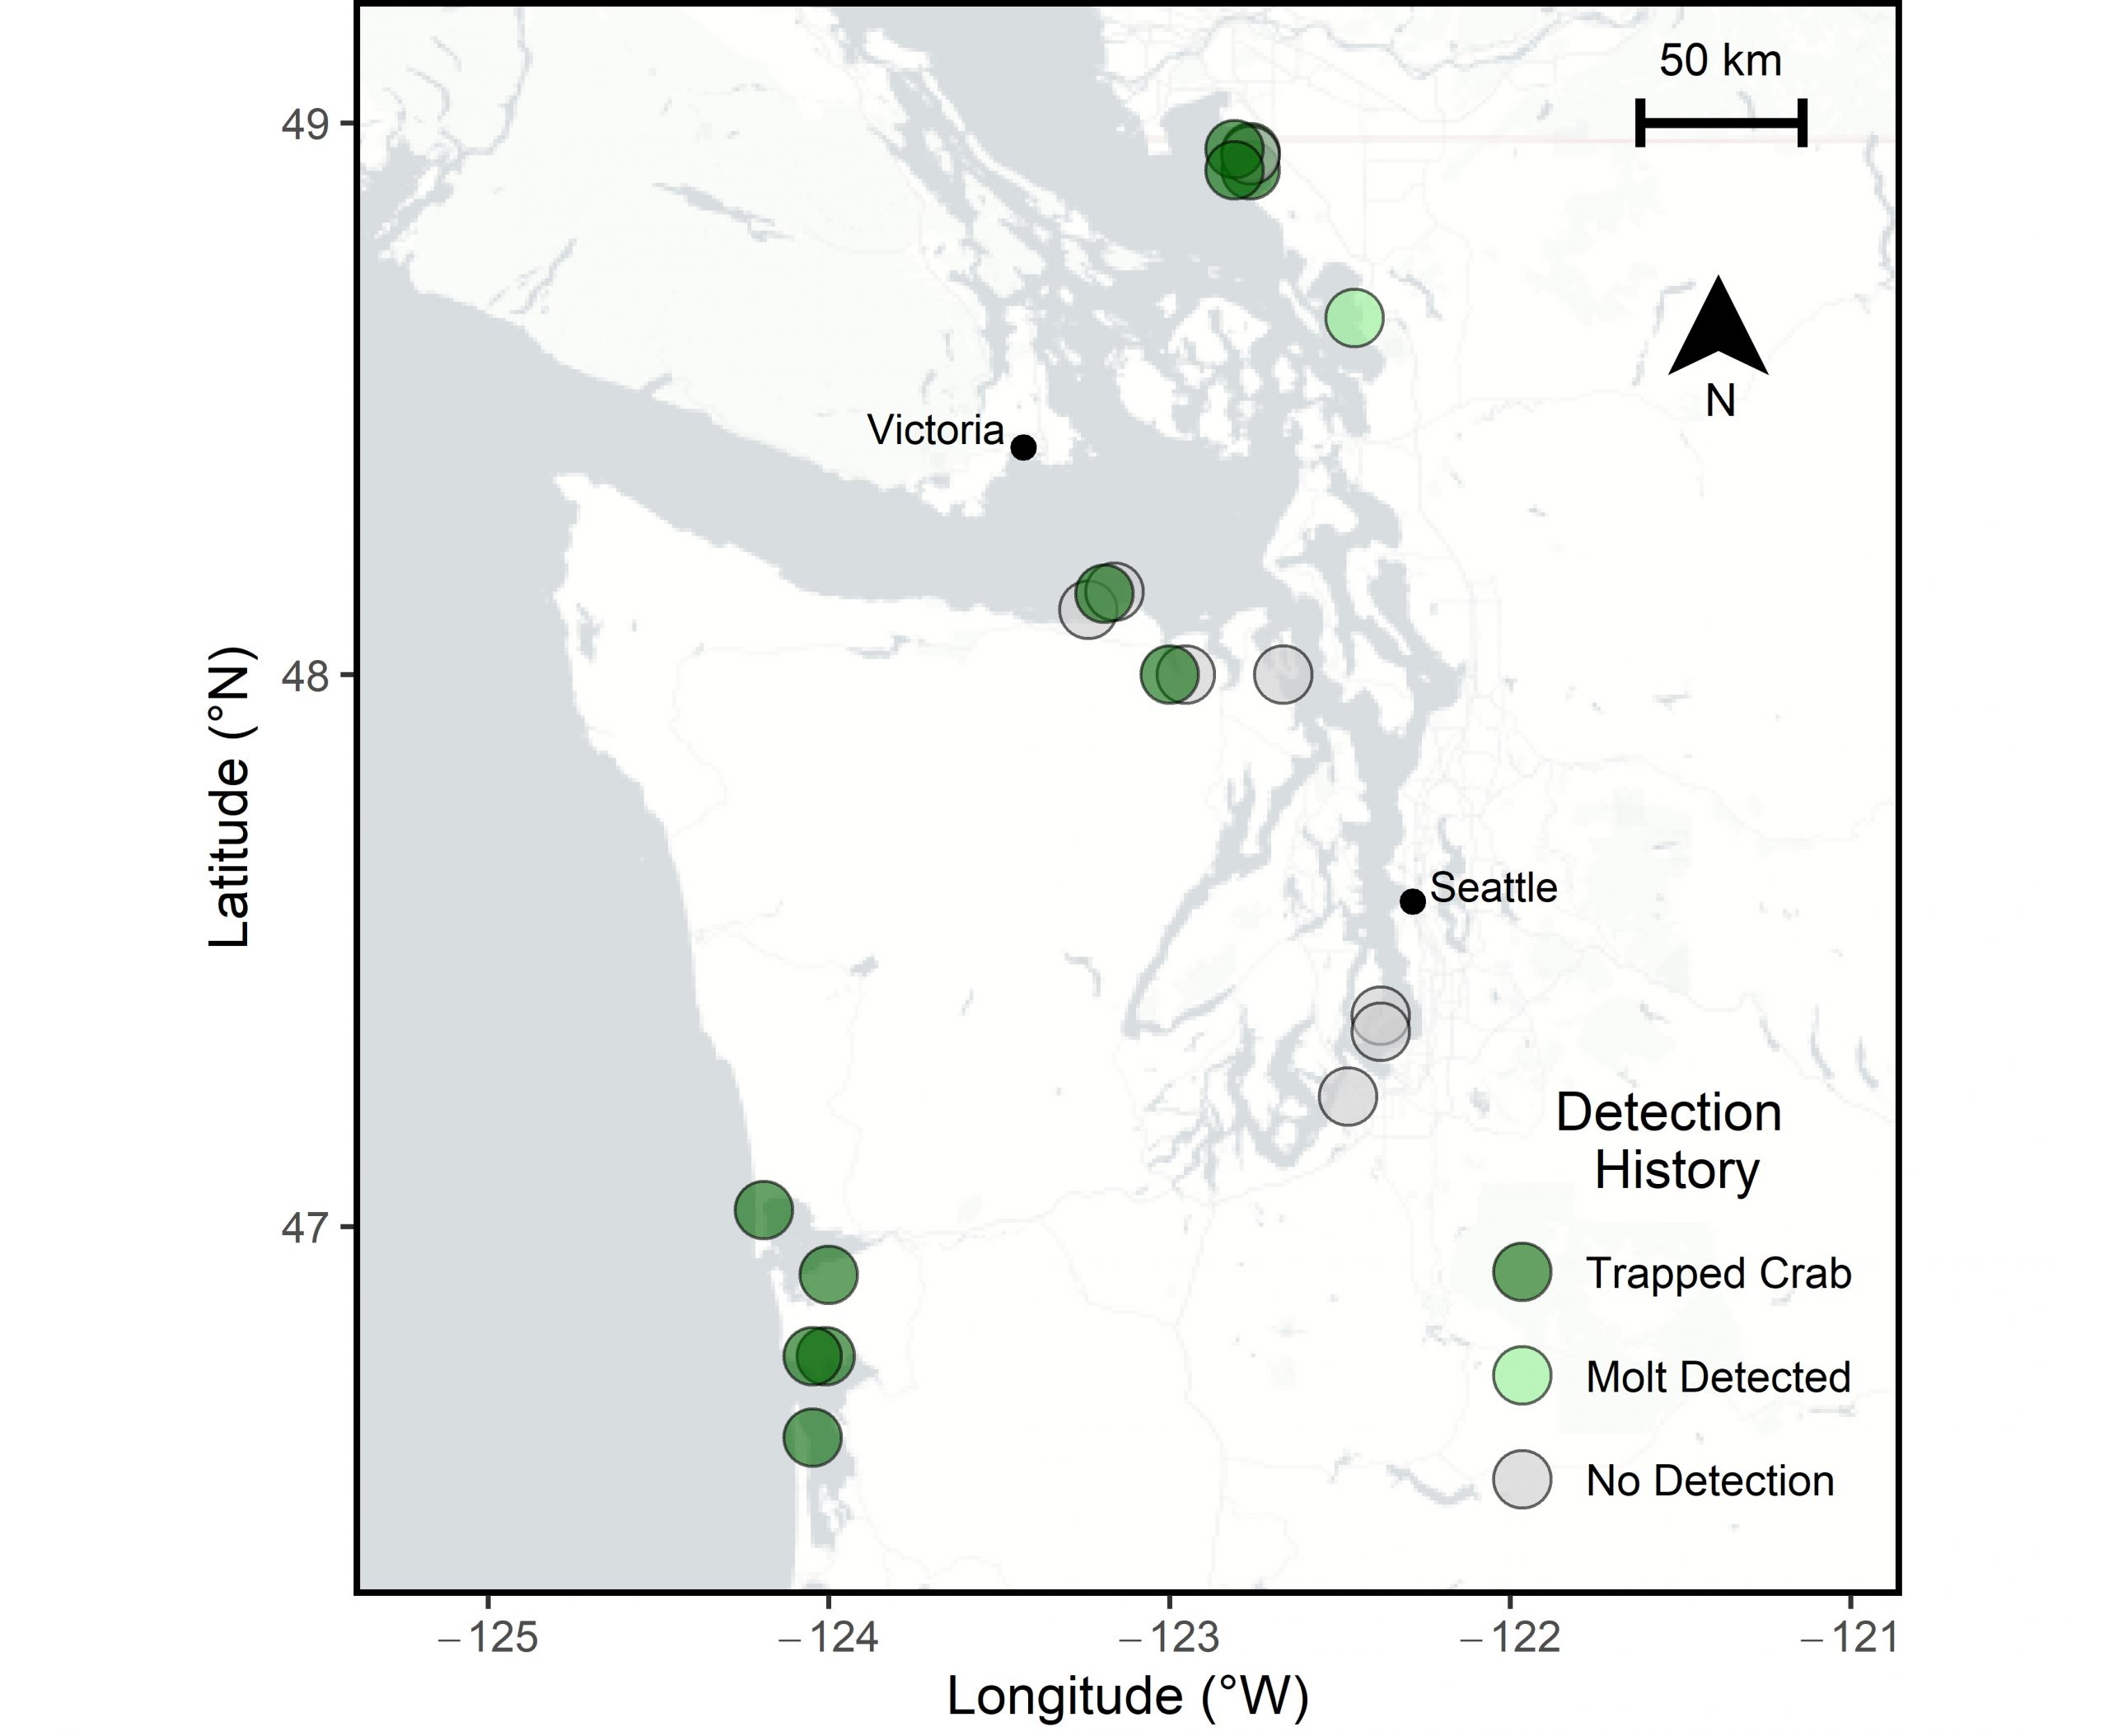
Figure 2. Sampling map for locations where results of eDNA and trapping surveys were compared and combined via the mathematical model. Sites are color coded based on whether green crabs were confirmed at the site via either trapping or molts. Click to enlarge.
The mathematical model enabled Abby to answer questions that managers might have when making decisions about what actions to take, when to use eDNA and how to interpret the outcomes of both trapping and eDNA sampling. The crux of this model is the ability to calculate confidence in green crab presence. That is, for a given data set of traps, or eDNA samples, or both, the model can estimate a range for the true density of green crabs at a site, and the statistical likelihood of that range. So, beyond detecting presence or absence of green crabs, this model can help managers gauge what population size they are up against, or whether they are making progress in meeting targets for trapping down crabs.
Abby and the team just published this research in the journal Ecological Applications, but here, in an exclusive interview, Abby speaks to some key takeaways about what she learned from the project:
CRAB TEAM: How sensitive is this eDNA assay compared to trapping in detecting green crabs?
ABBY KELLER: The chance of detecting a green crab at a site where they are really present with one eDNA sample (one bottle of water) is about the same as the chance of detecting green crabs with one trap.
CT: What is the probability of a false positive in eDNA detection?
AK: The chance of getting a false positive for any particular eDNA test depends not only on the system (green crabs) and the particular assay developed, but also even on the lab in which the work is done. This means the false positive rate can change depending on who is doing the work and where. So, while the model estimated a false positive rate of about 2% for this experiment, the most important thing is that someone else can use our modeling tool to calculate their own false positive rate for their particular combination of system, lab, assay, etc. By knowing this rate you can more confidently interpret positive detections you do get.
CT: Which type of sampling, trapping or eDNA, is the best type to use for early detection of green crabs?
AK: The model shows that there is actually not one that is better than the other, at least for this assay. The two sampling types are actually pretty similar in the information they give about the presence of green crabs, but they are very different in the protocols and technical needs. So, to some extent, the decision about which to use depends on logistics. If you want to sample a lot of different places, collecting water is a time-efficient way to get a lot of information, but eDNA requires the technical expertise and laboratory resources to process and analyze the results. Trapping requires less technical expertise but, because traps need to soak in the water to catch green crabs, trapping can be a more time-consuming technique, not to mention the physical demands of getting traps into the muddy, remote places green crabs like to live. So, a group or program can make a decision that’s a good logistical fit for their resources, and the model provides a way to understand how confident they can be in their results.
CT: What else can the model do?
AK: The model enables us to figure out how to best sample to achieve management goals. For instance, we can calculate how many traps to set, or eDNA samples to collect, in order to be, say, 95% confident about a particular green crab density. Or we can figure out how much we might be able to increase our confidence if we add traps or eDNA or our sampling regime.
…
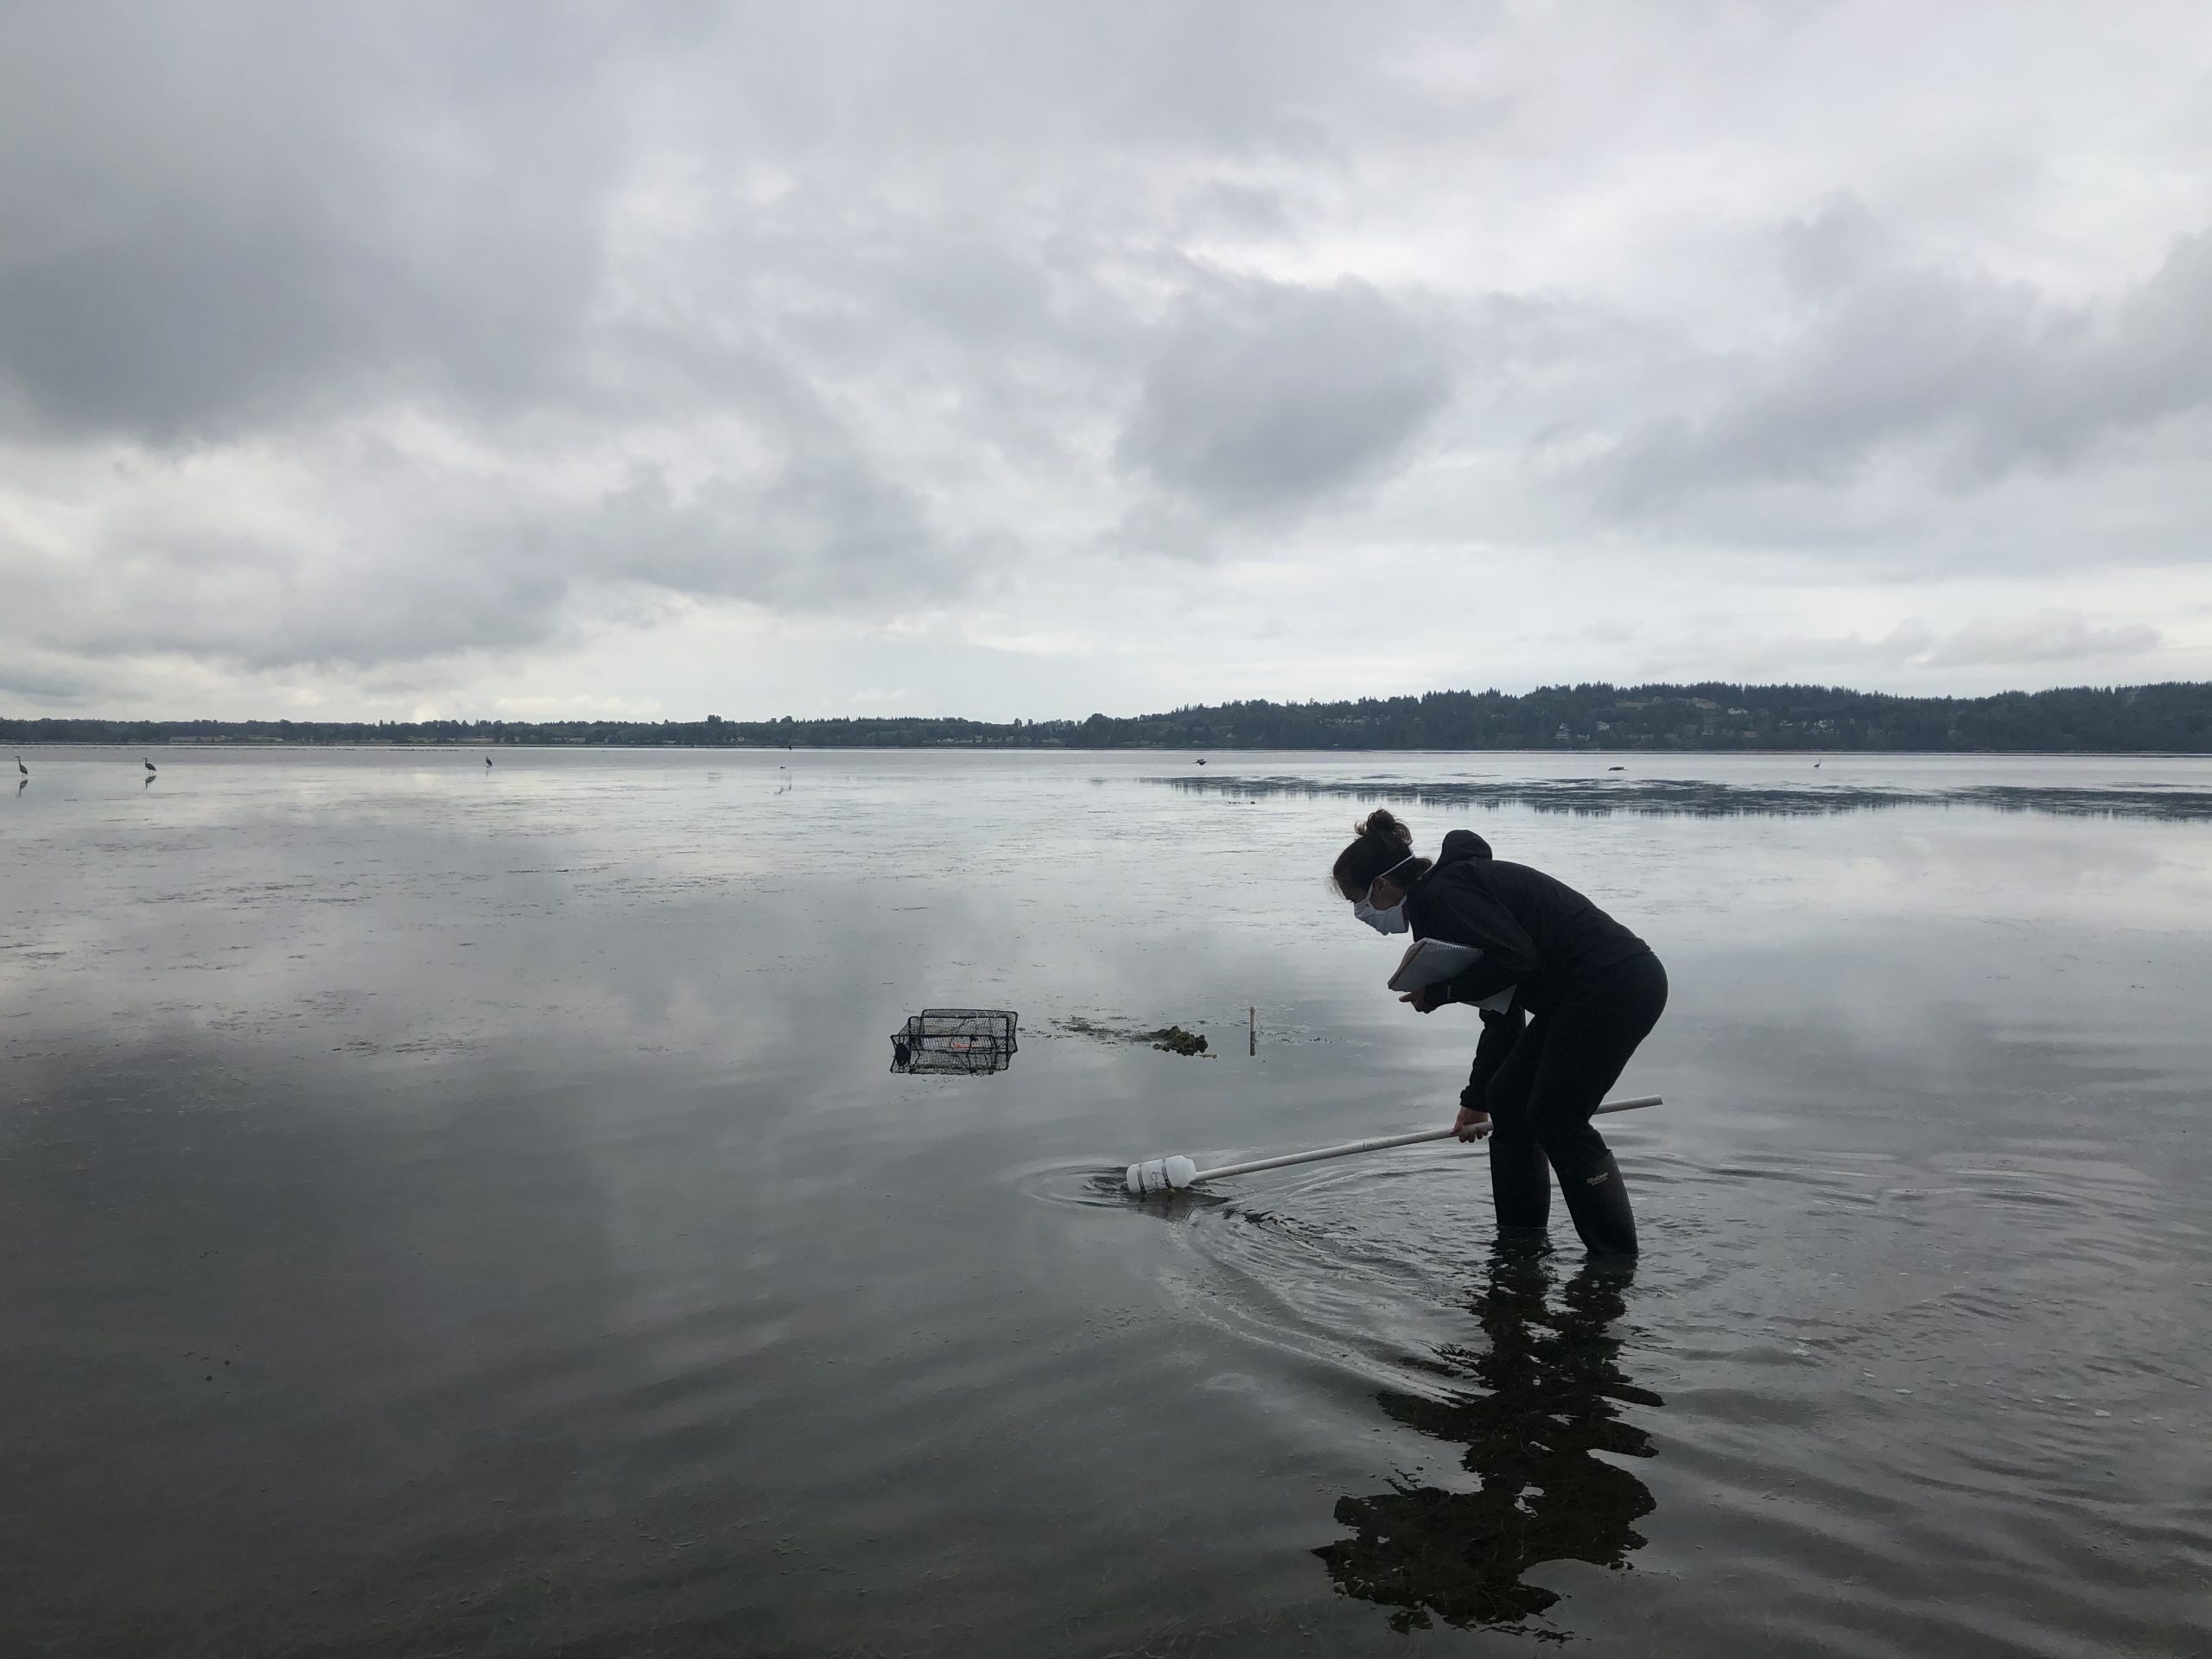
Abby collecting a water sample for eDNA analysis near a trapping site in Drayton Harbor. Photo: Emily Grason
While Abby used data from green crab efforts in Washington to answer these questions, the mathematical model could be used on other species, in other locations, with other eDNA assays or really any detection methods, based on available data. Says Abby, “eDNA and other methods of detecting species are typically seen as ‘apples and oranges’ in terms of providing two categorically different ways to look at what’s out there. But they are both imperfect lenses through which we try to view the same environment. The model is sort of like a blender, by which we bring the data together to make a fruit smoothie – better than the sum of the parts.’
Through Abby’s sampling efforts, she also happened to run into a great opportunity to bring all the pieces of the puzzle together in a real life management situation, which will be shared in the next post.
Read the next post in the series
-Emily Grason and Justine Jadallah
Justine Jadallah is a senior in the UW Program on the Environment capstone program and guest co-authors this blog post series as part of her project to investigate barriers to the adoption of eDNA as a management tool.
MAR
2022